Fig. 5.
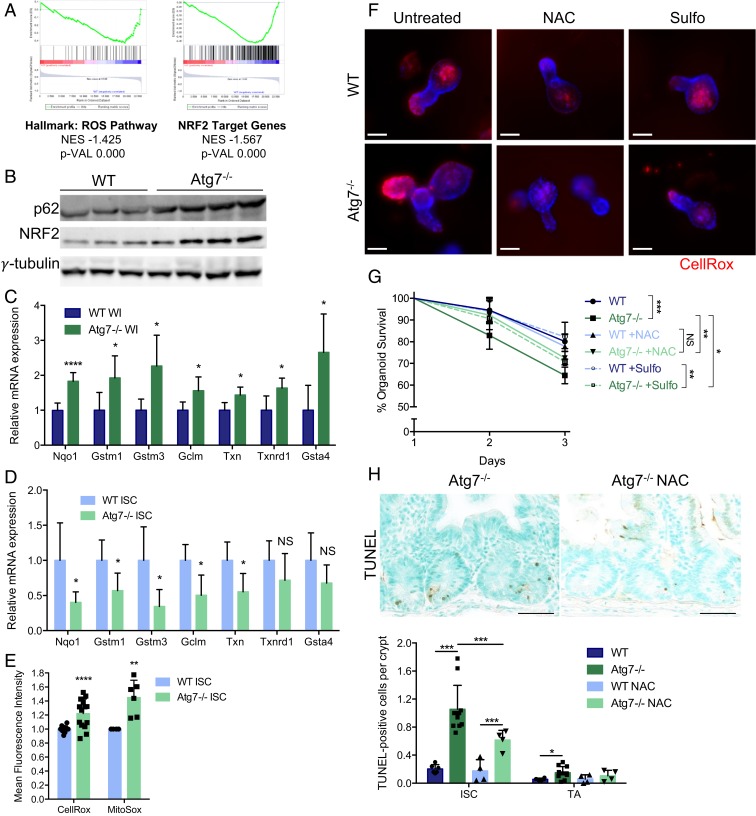
Defective antioxidant responses and ROS accumulation contribute to the death of Atg7-deficient Lgr5+ISC. (A) Enrichment plots generated by GSEA for the hallmark ROS pathway and NRF2 target gene sets based on transcriptomic data from sorted Lgr5+ISC from Lgr5Atg7−/− and Lgr5WT mice. NES, normalized enrichment score; p-VAL, P value. (B) Western blotting for p62 and NRF2 on whole-intestinal (WI) tissue lysates from WT and Atg7−/− mice. γ-Tubulin was used as a loading control. Three WT and four Atg7−/− mice are shown. (C) Relative mRNA levels for NRF2 target genes encoding antioxidant response proteins as assessed by qRT-PCR analysis of whole-intestinal tissue lysates from four WT and five Atg7−/− mice. The data shown are means ± SD. (D) Relative mRNA levels for NRF2 target genes encoding antioxidant response proteins as assessed by qRT-PCR analysis of sorted Lgr5+ISC from Lgr5WT and Lgr5Atg7−/− mice. The data shown are means ± SD (n = 4 to 6 mice per condition). (E) Mean CellROX or MitoSOX fluorescence intensity of sorted Lgr5+ISC from Lgr5WT and Lgr5Atg7−/− mice. The data shown are means ± SD (n = 13 Lgr5WT and n = 14 Lgr5Atg7−/− mice for CellROX analysis, n = 4 Lgr5WT and n = 6 Lgr5Atg7−/− mice for MitoSOX analysis). (F) Representative CellROX staining on live organoids from the crypts of WT and Atg7−/− mice after 3 d in culture in the presence or absence of NAC or sulforaphane (Sulfo) in the culture medium. Hoechst stain was used as a nuclear counterstain. (Scale bars: 50 µm.) (G) Percentage survival from day 1 of organoids from the crypts of WT and Atg7−/− mice in the presence or absence of NAC or Sulfo in the culture medium (n = 5 mice for each genotype). Significant differences are shown in the legend for day 3. (H) Representative TUNEL staining on tissue sections from Atg7−/− mice treated with water or NAC. Quantification of the percentage of TUNEL-positive crypts and the mean number of TUNEL-positive cells per crypt over 50 consecutive whole crypts in 6 control WT mice, 11 control Atg7−/− mice, and 4 NAC-treated mice of each genotype. The data shown are means ± SD. Significant differences are shown with asterisks. NS, not statistically significant. (Scale bars: 50 µm.) *P < 0.05; **P < 0.01; ***P < 0.005; ****P < 0.001.

