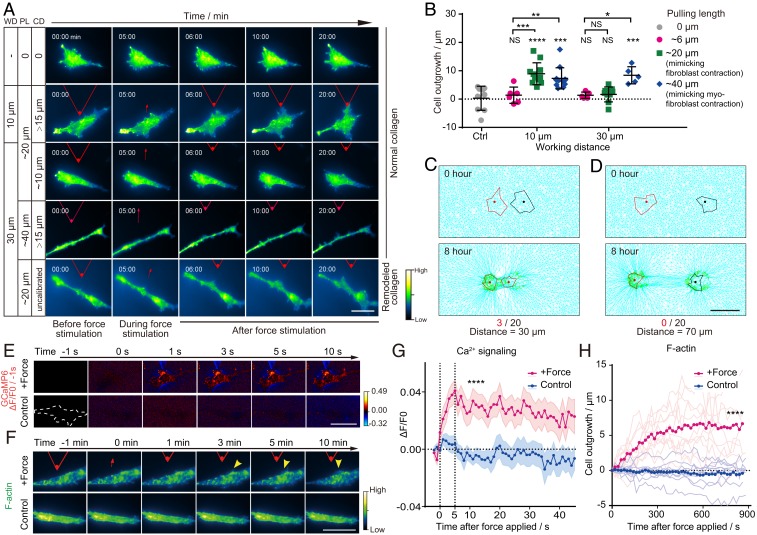
Fig. 3.
Transmitting distance and response time of cells to paratensile signaling. (A) Representative images of dynamic changes in F-actin in fibroblasts (LX2) under different pulling lengths (PL), working distances (WD), and collagen deformation (CD) at the boundary of a fibroblast. (Scale bar, 50 μm.) See also Movie S3. (B) Quantitative analysis of the lengths of actin outgrowths before and after paratensile stimulation in A (n ≥ 6 as indicated, two-way ANOVA; from left to right and top to bottom, **P = 0.0079, *P = 0.0139, ***P = 0.0005, NS P = 0.9989, NS P = 0.9366, ****P < 0.0001, ***P = 0.0002, NS P = 0.9509, NS P = 0.8531, and ***P = 0.0008, respectively; NS, not significant). (C) In silico modeling of cell activation by paratensile signaling applied by a neighboring cell with a spacing distance of 30 μm (3 activations out of 20 simulations). (D) No cells could be activated by paratensile signaling when the simulated spacing distance was increased to 70 μm (0 activations out of 20 simulations). (Scale bar, 50 μm.) See also Movie S4. (E) Representative images of calcium changes in LX2 after paratensile stimulation. (Scale bar, 50 μm.) See also Movie S5. (F) Representative images of actin remodeling in LX2 after paratensile stimulation. (Scale bar, 50 μm.) See also Movie S5. (G) Dynamic changes in the calcium signal after paratensile stimulation. Magenta and blue areas indicate the mean ± SEM in each group (n = 30 in each group, Student’s t test, ****P < 0.0001). (H) Dynamic changes in actin outgrowth after paratensile stimulation. Each light magenta (force stimulation) or light blue (control) line indicates one replicate in each group (n ≥ 11 in each group, Student’s t test, ****P < 0.0001). Data are expressed as mean ± SD.

