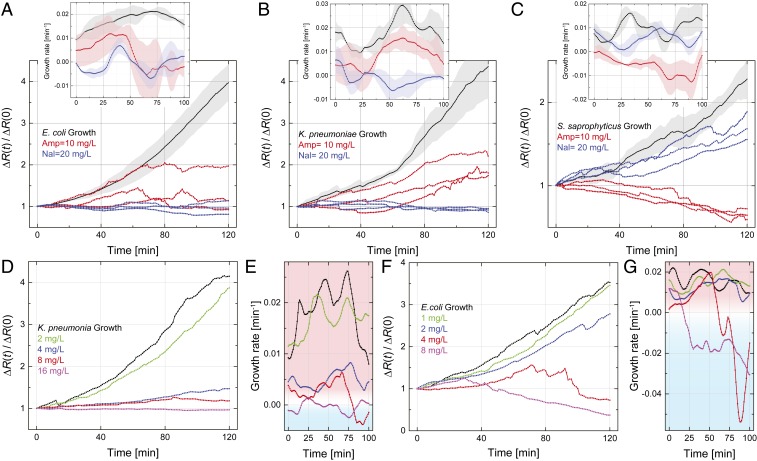
Fig. 3.
(A–C) Electrical determination of the susceptibility of (A) E. coli, (B) K. pneumoniae, and (C) S. saprophyticus to ampicillin and nalidixic acid. Normalized resistance changes as a function of incubation time under different conditions are plotted for each strain. The black curve in each plot is the average growth curve in LB broth without antibiotics at 37 °C from Fig. 2B, with the shaded region showing the SD; the red and blue curves show the electrical signal in LB broth with added ampicillin (10 mg/L) and nalidixic acid (20 mg/L), respectively, at 37 °C. Each colored curve represents one independent experiment. Insets show the growth rate, , calculated from the normalized resistance changes in the main plots; each solid line and shaded region, respectively, show the average value and the SD from three experiments. (D–G) Determination of MIC. (D) Normalized resistance change for K. pneumoniae as a function of incubation time in human urine with different concentrations of nalidixic acid. (E) Growth rates for each curve in D. (F) Determination of ampicillin MIC for E. coli in human urine. (G) Growth rates for each curve in F.

