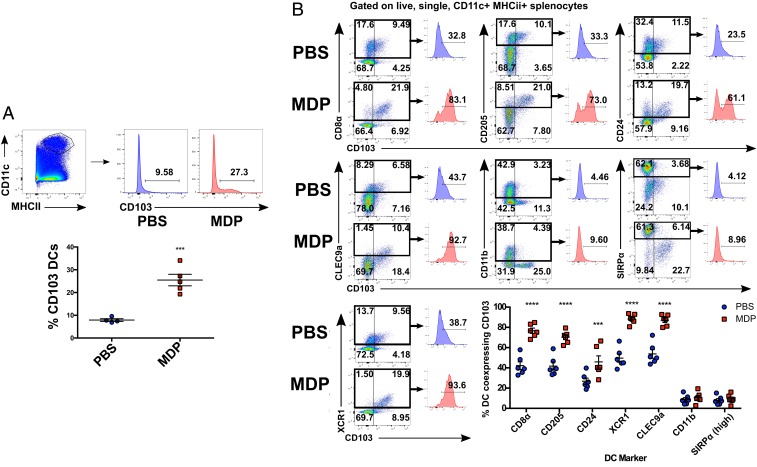
Fig. 2.
Systemic activation of NOD2 leads to increased CD103 expression on splenic cDC1s. (A) Flow cytometry analysis of CD103 expression on CD11c+MHCII+ cells from murine spleen following injection with MDP (50 μg i.p.). (B) Flow cytometry analysis of CD103 expression on DCs displaying specific subset markers. Individual mice from one representative experiment are denoted on the plots. Horizontal bars denote the mean, and error bars denote SEM. Asterisks denote significantly different from PBS treated as calculated by two-way ANOVA followed by Tukey’s multiple comparisons test; *P < 0.05; ***P ≤ 0.001; ****P ≤ 0.0001.

