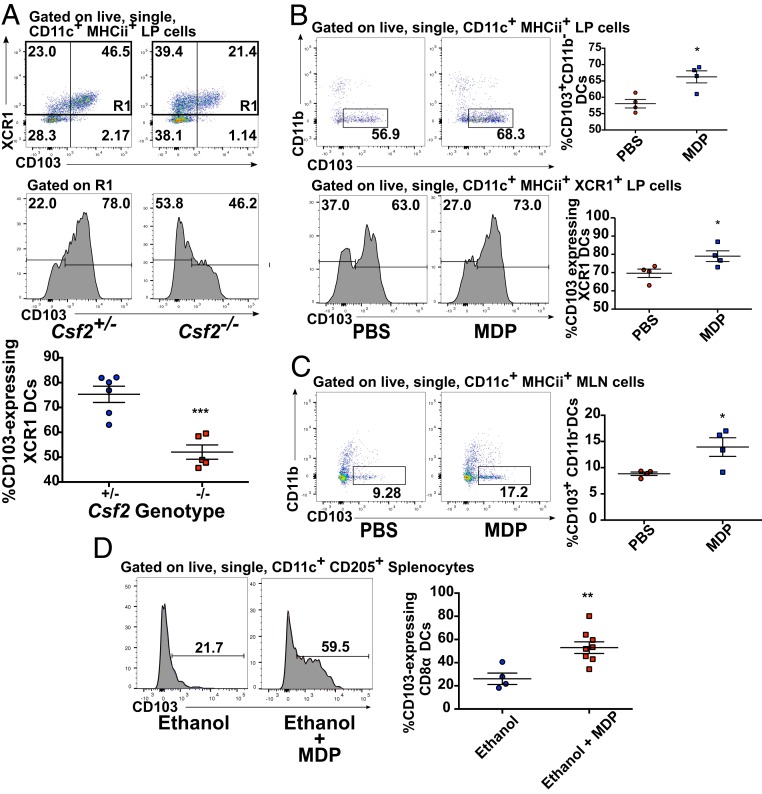
Fig. 7.
NOD2 activation alters the balance of DC subsets in the large intestine. (A) Flow cytometry analysis of XCR1 and CD103 expression on colonic LP DCs isolated from untreated Csf2+/− and Csf2−/− littermate mice. (B) Flow cytometry analysis of colonic LP DCs collected from C57BL/6J assessing the proportions of CD103+CD11b− DCs (Upper) or CD103-expressing XCR1+ DCs (Lower) 24 h postadministration of 100 μg of MDP via intrarectal catheter. (C) Flow cytometry analysis of MLN DCs collected from C57BL/6J assessing the proportions of CD103+CD11b− DCs 24 h postadministration of 100 μg of MDP via intrarectal catheter. (D) Flow cytometry analysis of CD103 expression on splenic cDC1s isolated 24 h postadministration from mice treated with 300 μg of MDP in 50% ethanol or 50% ethanol alone delivered via an intrarectal catheter. For all images, individual mice from one representative experiment are shown. Horizontal bars denote the mean, and error bars denote SEM. Asterisks denote significantly different from heterzygote control (A), PBS control (B and C), or ethanol control (D) as calculated by Student’s t test. *P ≤ 0.05, *P ≤ 0.01, ***P ≤ 0.001.

