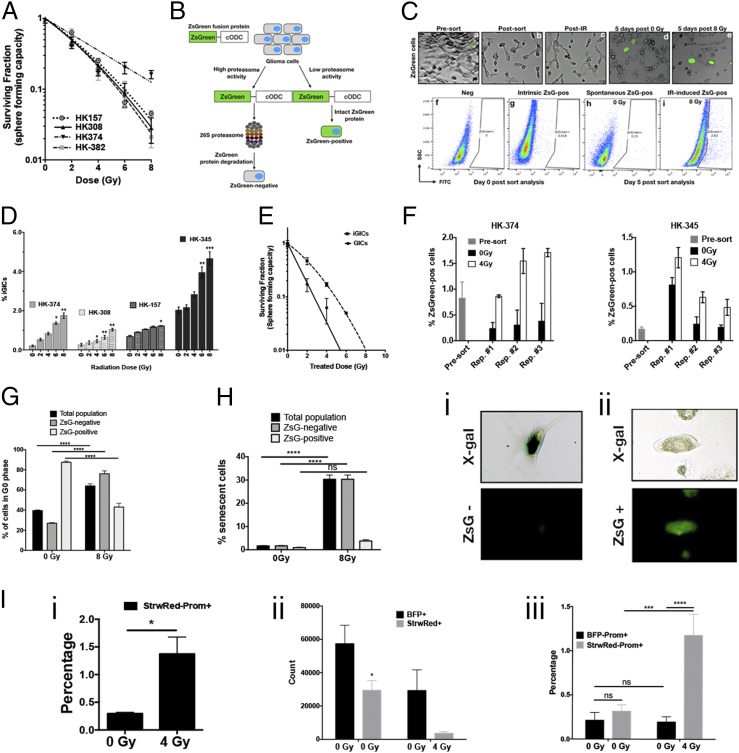
Fig. 1.
Radiation induces phenotype conversion in GBM. (A) Four primary patient-derived GBM lines (parent HK-157, HK-308, HK-374, and HK-382) were seeded as single-cell suspension cultures in 96-well plates containing serum-free medium and exposed to radiation doses of 0, 2, 4, 6, or 8 Gy. The spheres were maintained by feeding with fresh growth factors (10× medium) regularly. The number of spheres formed at each dose point was counted and normalized against their respective nonirradiated control. The final curve was generated using a linear quadratic model. (B) Schematic representation of the ZsGreen-cODC reporter system. (C) Representative images (10×) of HK-374 ZsGreen-cODC infected cells before and after sort (a and b), after irradiation (c), 5 d after 0 Gy irradiation (d), and 5 d post 8-Gy irradiation (e). Flow sort analysis representative images of HK-374−negative cells (f), HK-374 cells before sorting (g), 0-Gy sample 5 d postirradiation (h), and 8-Gy samples 5 d postsorting (i). (D) Four primary patient-derived GBM lines (HK-308, HK-374, HK-157, and HK-345) were infected with ZsGreen-cODC reporter vector and maintained as an adherent culture in a 10% serum-containing medium. After selection, the cells were sorted to deplete the ZsGreen-cODC−positive GICs. The remaining population consisting of differentiated ZsGreen-cODC−negative glioma cells were plated at a density of 50,000 cells per well in a six-well plate and, the following day, irradiated with single doses of 0, 2, 4, 6, or 8 Gy. Five days later, the cells were detached and analyzed for ZsGreen-cODC−positive cells by flow cytometry, using their noninfected parent lines as controls, and represented as percentage iGICs. (E) ZsGreen-cODC vector-expressing HK-374 cells were sorted, and the ZsGreen-cODC−positive cells obtained were seeded in a 96-well plate for sphere formation assay. The remaining population was plated and subjected to irradiation at 0, 2, 4, 6, or 8 Gy. Five days later, the cells were detached and sorted for ZsGreen-cODC−positive cells. These iGICs were then seeded in a 96-well plate for sphere formation assay. The number of spheres formed at each dose point was counted and normalized against the control. The resulting data were fitted using the linear quadratic model. (F) ZsGreen-cODC vector-expressing HK-374 and HK-345 cells were sorted for ZsGreen-cODC−negative cells and irradiated at 4 Gy. Five days later, a small portion of these cells were used for flow cytometry to analyze for percentage of ZsGreen-cODC−positive cells. The remaining cells were sorted for ZsGreen-cODC−negative cells and again irradiated at 4 Gy. This approach was followed two more times. The ZsGreen-cODC−positive cells obtained after each repeat were graphed and presented as percentage ZsGreen-cODC−positive cells. (G) Cell cycle analysis demonstrating percentage of cells in G0 phase of the cell cycle in three different cell populations—total, ZsGreen-cODC−negative, and ZsGreen-cODC−positive cells, after 5 d of irradiation with a single dose of 0- and 8-Gy irradiation. (H) Cellular senescence analysis 5 d post single dose of 0- and 8-Gy irradiation in HK-374 ZsGreen-cODC infected cells demonstrating percentage of senescent cells in three different populations—total, ZsGreen-negative, and ZsGreen-cODC−positive cells. Representative images of a cell showing positive for X-gal but negative for ZsGreen-cODC protein (i); representative image (20×) of a cell showing negative for X-gal but positive for ZsGreen-cODC protein (ii). (I) GL261-StrawRed cells were first sorted for cells negative for Prominin. The sorted cells were then irradiated with a single dose of 4 Gy and incubated at 37 °C in a CO2 incubator for 5 d. Percentage of Prominin+ cells in the cell preparation from the presort (0 Gy) and the sorted, irradiated, and 5-d postincubation (4 Gy) GL261-sorted-irradiated-StrawRed cells were analyzed by performing flow cytometry (i). Next, 1:1 ratio of the sorted GL261-StrawRed cells and the unsorted GL261-BFP cells were intracranially implanted into C57BL/6 mice. Three weeks postimplantation, the brains of the mice were extracted and tumor cells were dissociated and labeled with anti-Prominin antibody. The antibody-labeled cells were subjected to flow cytometric analysis, and the number of either StrawRed or BFP-positive cells obtained from each brain dissociation prep was graphed (ii); the cells positive for both StrawRed and Prominin or BFP and Prominin were also graphed and presented as percentage positive (iii). All experiments in this figure have been performed with at least three biological independent repeats. P values were calculated using unpaired t test. *P value < 0.05, **P value < 0.01, ***P value < 0.001, and ****P value < 0.0001, ns, no significance.

