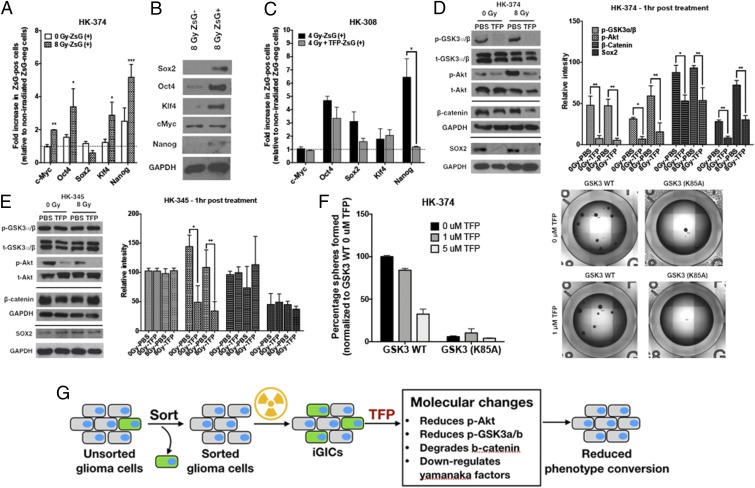
Fig. 3.
TFP reduces stem cell factors at the transcriptional and posttranslational level. ZsGreen-cODC−negative cells were collected after sorting the HK-374 ZsGreen-cODC vector-expressing cells and plated in a six-well plate at a density of 50,000 cells per well. The cells were irradiated at 0 or 8 Gy the following day. Five days after incubation, the cells were detached and resorted to collect both ZsGreen-cODC−positive and ZsGreen-cODC−negative cells. (A) The qPCR was performed using RNA isolated from these samples. GAPDH was used as the internal control. The fold change in expression levels of Yamanaka factors in 0- and 8-Gy ZsGreen-cODC−positive cells was calculated by 2^-ddCt method by normalizing it to nonirradiated ZsGreen-cODC−negative cells. (B) Western blotting was performed with the proteins extracted from 8-Gy ZsGreen-negative and ZsGreen-positive cells, and the membrane was blotted for Sox2, Oct4, Klf4, c-Myc, and Nanog. GAPDH was used as the internal control. (C) ZsGreen-cODC−negative cells were collected after sorting the HK-308 ZsGreen-cODC vector-expressing cells and plated in a six-well plate at a density of 50,000 cells per well. The cells were pretreated with TFP (10 μM) 1 h before irradiating at 0 or 4 Gy the following day. Five days after incubation, the cells were detached and resorted to collect both ZsGreen-cODC−positive and ZsGreen-cODC−negative cells. The qPCR was performed using RNA isolated from these samples. GAPDH was used as the internal control. The fold change in expression levels of Yamanaka factors in 0- and 4-Gy ZsGreen-cODC−positive cells was calculated by 2^-ddCt method by normalizing it to nonirradiated ZsGreen-cODC−negative cells. (D and E) The 90% confluent plates with parent HK-374 and HK-345 cells were serum starved overnight and pretreated with either TFP (10 μM) or vehicle (saline) for 1 h. Just before irradiating these plates with a single dose of 0 or 8 Gy, a second treatment with TFP or saline was performed. Starting from the second treatment, the samples were collected at exactly 1-h time point for protein analysis using Western blotting. The blots were analyzed for p-GSK3a/b, t-GSK3a/b, p-Akt, t-Akt, β-catenin, Sox2, and GAPDH. GAPDH was used as the loading control for β-catenin and Sox2. (D and E) The intensity of each band was calibrated using ImageJ and presented as density ratio of gene over GAPDH in HK-374 and HK-345 cells. (F) HK-374 cells were transduced with lentiviral vector-expressing GSK3 (K85A) mutant gene. HK-374 containing GSK3 WT cells along with HK-374 cells with GSK3 (K85) mutant gene were plated in 96-well plates and treated with TFP (0, 1, and 5 μM). This setup was maintained with regular feeding of the spheres with 10× growth factors. The number of spheres formed in each condition was counted and normalized against the GSK3 WT nonirradiated control. Representative images are of GSK3 WT and GSK3 (K85A) mutant cells at 0 and 5 μM TFP. (G) Schematic representation on how TFP inhibits phenotype conversion. All experiments in this figure have been performed with at least three biological independent repeats. P values were calculated using unpaired t test. *P value < 0.05, **P value < 0.01, and ***P value < 0.001.

