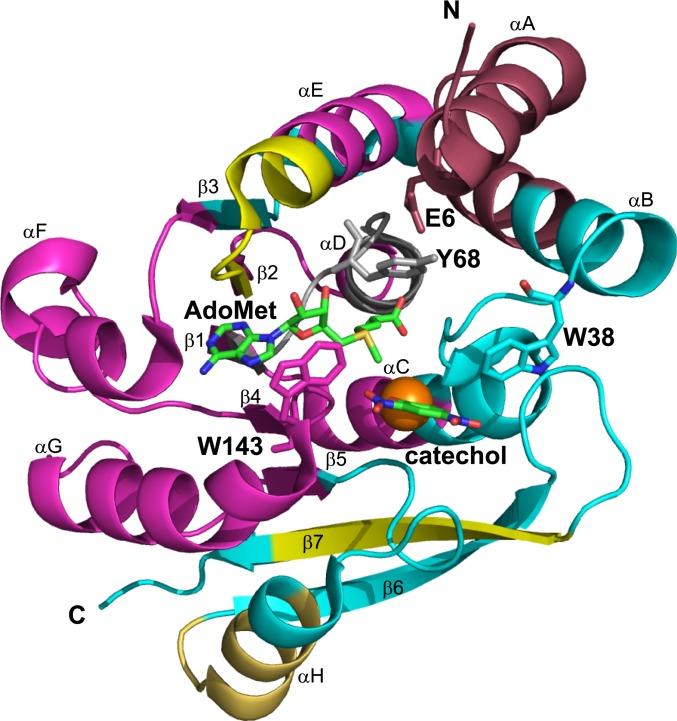
Fig. 4.
The mapping of variations in HDX behavior between WT and Y68A. The regions colored magenta correspond to positions showing a break in the temperature dependence of HDX in Y68A at 20 °C. Color coding for the remainder of the protein is as in Fig. 2.

