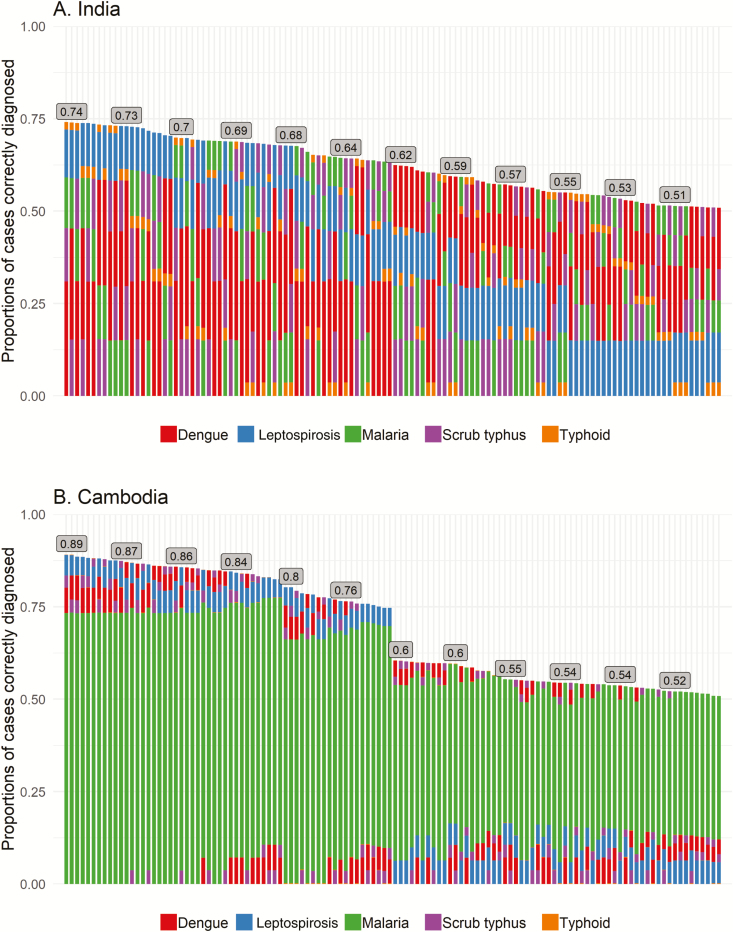
Figure 2.
Algorithms with tests in different orders, for India (A) and Cambodia (B). Each column represents 1 of the 120 algorithms of 5 tests. The algorithms are arranged from left to right in decreasing correct diagnosis score. The stacked bars in each column represent the 5 tests that are performed in a sequential order, with the first test at the bottom of the column and the fifth test at the very top. The length of each bar represents the contribution of each test to total correct diagnosis score.

