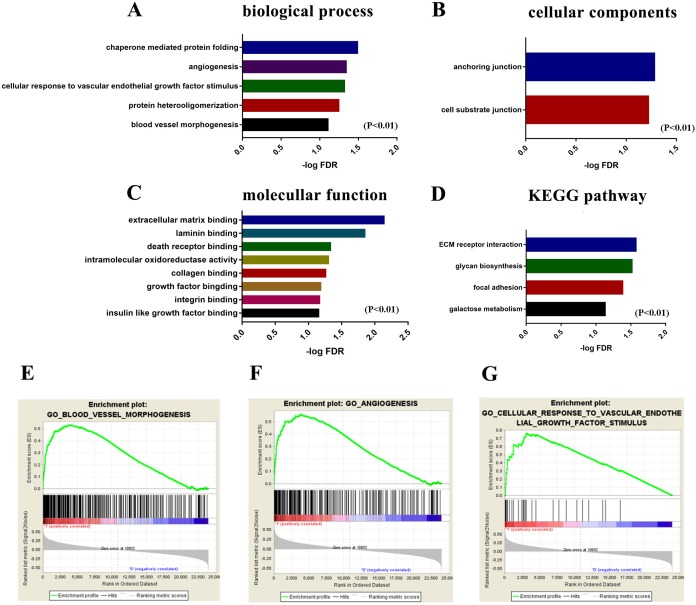
Figure 4. Functional enrichment analysis of gene signature of macrophages.
GO term and KEGG pathway analysis for the high macrophage-infiltrating group. Pathways with FDR < 0.1 P < 0.01 are shown. (A) Biological process. (B) Cellular components. (C) Molecular function. (D) KEGG pathway. (E) Enrichment profile generated with GSEA in the gene set “blood vessel morphogenesis” comparing high vs. low M0 macrophage-infiltrating group. (F) Enrichment profile generated with GSEA in the gene set “angiogenesis”. (G) Enrichment profile generated with GSEA in the gene set “cellular response to vascular endothelial growth factor stimulus”.

