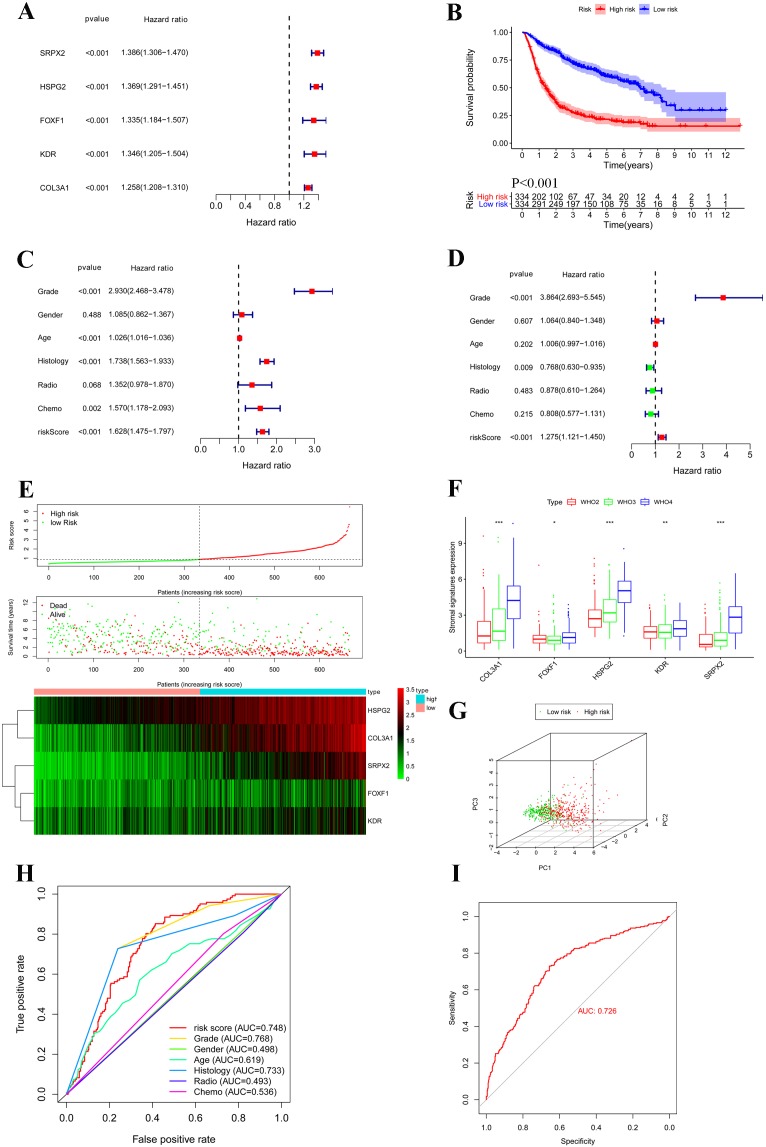
Figure 6. Construction and verification of prognostic classifier based on stromal signatures.
(A) Forest map based on the univariate COX regressions of five stromal signatures. Right vertical dotted line indicates risk genes. (B) Kaplan–Meier survival curves were generated for the comparison of groups of high (red line) and low (blue line) risk score. (C and D) Forest map based on the univariate and multivariate COX regressions which enrolled clinical features and stromal signatures in the overall set. (E) Five stromal signatures were enrolled in the risk model heatmap. (F) Boxplot shows five stromal signatures were correlated with WHO grades. (G) Principal component analysis shows significant different between groups of low (green dots) and high (red dots) risk score. (H) Receiver operating characteristic (ROC) curve plotted to determine the effect of the classifier and compare with other clinical features. (I) The classifier was verified in an independent TCGA cohort. *p < 0.05; **p < 0.01; ***p < 0.001.

