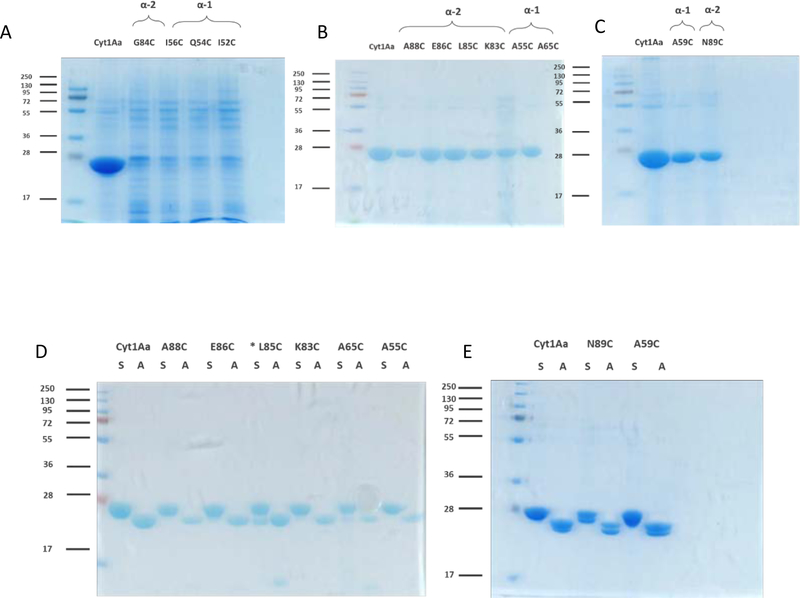
Figure 1. Production and activation of Cyt1Aa helices α−1 and α−2 mutants.
A. Analysis of spore/crystal samples of Cyt1Aa and Cyt1AaG84C, Cyt1AaI56C, Cyt1AaQ54C and Cyt1AaI52C. B. Analysis of spore/crystal samples of Cyt1Aa, Cyt1AaA88C, Cyt1AaE86C, Cyt1AaL85C, Cyt1AaK83C, Cyt1AaA55C, Cyt1AaA65C. C. Analysis of spore/crystal samples of Cyt1Aa and Cyt1AaA59C, Cyt1AaN89C after sporulation of Bt strain containing each of these cyt1Aa genes. D. and E. Analysis of soluble Cyt1Aa protoxins and activated Cyt1Aa proteins after activation with trypsin as described in Materials and Methods. D. Cyt1Aa, Cyt1AaA88C, Cyt1AaE86C, Cyt1AaL85C, Cyt1AaK83C, Cyt1AaA65C and Cyt1AaA55C. E. Cyt1Aa, Cyt1AaN89C and Cyt1AaA59C. All Cyt1Aa spore crystal samples were solubilized with 50 mM Na2CO3/NaHCO3 pH 10.5 and treated with trypsin as indicated in Materials and Methods. * Cyt1Aa85C was solubilized with 50 mM NaOH and treated with trypsin as indicated in Materials and Methods. Molecular weight markers are indicated in kDa in the left of each panel.

