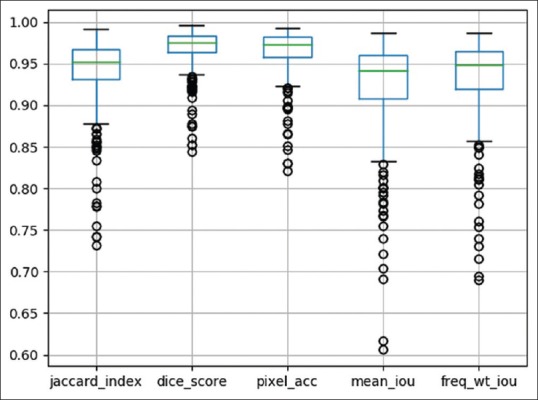
Figure 10.

Boxplot of EpithNet-mc model with distribution of the metrics on 311 images. The column parameters from left to right indicate Jaccard index, Dice score, pixel accuracy, mean intersection over union, and frequency-weighted intersection over union. See equations (4)–(8) above with accompanying parameter descriptions
