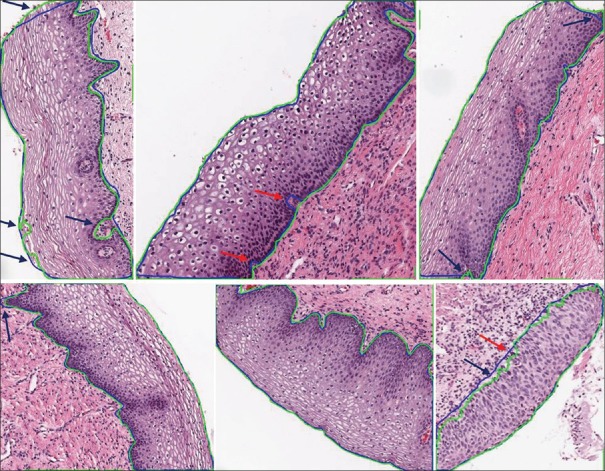
Figure 11.
Segmentation results. Green contour represents the predicted mask and blue contour represents the ground-truth mask. The blue arrows point to regions where the predicted masks do a better job in segmenting the epithelium regions compared to the manually drawn borders. The red arrows indicate regions of false segmentation

