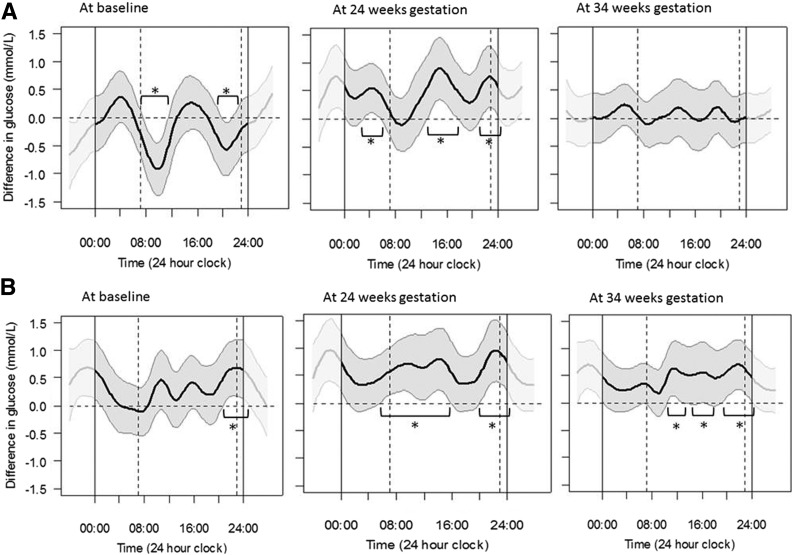
Figure 2.
Differences in mean temporal glucose levels across the 24-h day, assessed by FDA. A: Differences in women who used pumps (represented by dark wavy line) compared with those on MDI (represented by the horizontal zero dotted line) with 95% pointwise CIs (gray section). B: Differences in women who gave birth to an LGA infant (represented by the dark wavy line) compared with those who did not (represented by the horizontal zero dotted line) with 95% pointwise CIs (gray section). Dashed vertical lines represent daytime at 0700 h and 2300 h. *Significant differences using 95% CIs.

