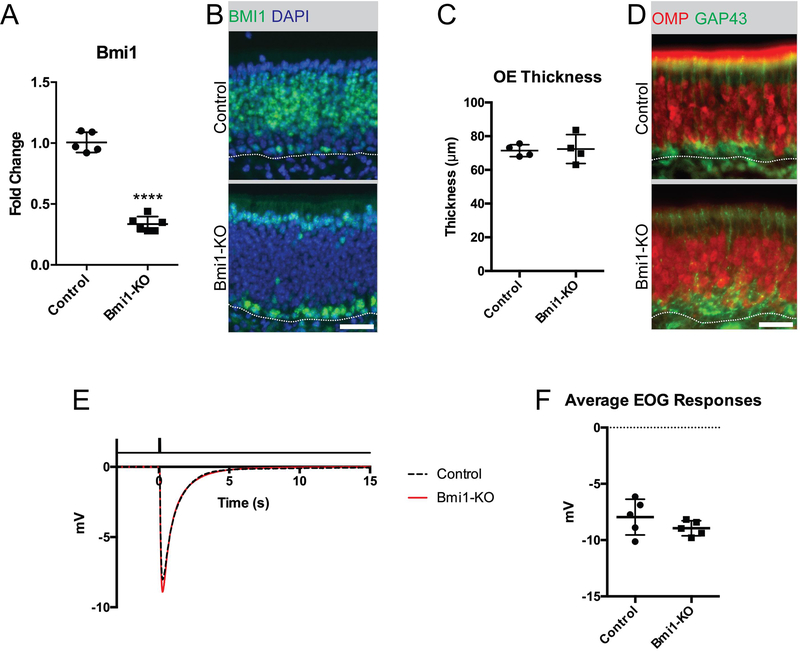
Figure 1. Neuronal organization and olfactory function remain intact in mice with OSN-specific Bmi1-KO.
(A and B) Gene expression analysis and immunofluorescence of BMI1, ****p<0.0001, n=5.
(C) Measurements of OE thickness, p=0.854, n=4.
(D) Representative immunofluorescence of OMP, a marker for mature OSNs, and GAP43, a marker for immature OSNs.
(E) Average traces of electro-olfactogram recordings from all animals in control vs. Bmi1-KO group. Solid black line at the top of the panel indicates the timing of 0.1M amyl acetate stimulation for a duration of 0.1 seconds, n=5.
(F) Average of mean peak EOG responses per animal, p=0.234, n=5.
Dotted lines in B and C mark the basal lamina, bar is 25μm.

