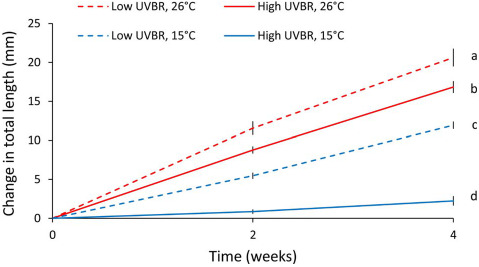
Figure 2.

Effect of high (solid lines) and low (dashed lines) UVBR in combination with either low (blue lines) or high (red lines) temperature on the growth (as a change in total length) of a random subset of L. peronii larvae over the 4-week exposure period (n = 21–54; Experiment 1). Data are presented as means ± standard error at two time points (Weeks 2 and 4). Letters denote significant differences between treatment groups (same for Weeks 2 and 4)
