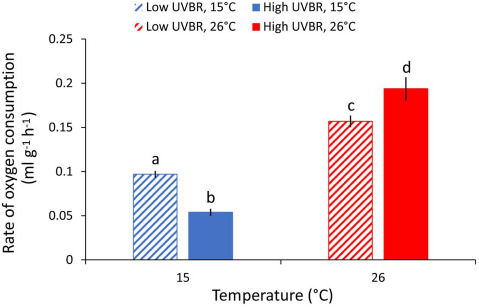
Figure 4.

Effect of high (solid bars) and low (patterned bars) UVBR in combination with either low (blue bars) or high (red bars) temperature on the mass specific rate of oxygen consumption (mL h−1 g−1) of L. peronii larvae (n = 17 to 18 per treatment; Experiment 1). Data are presented as means ± standard error, and letters denote significant differences between treatment groups
