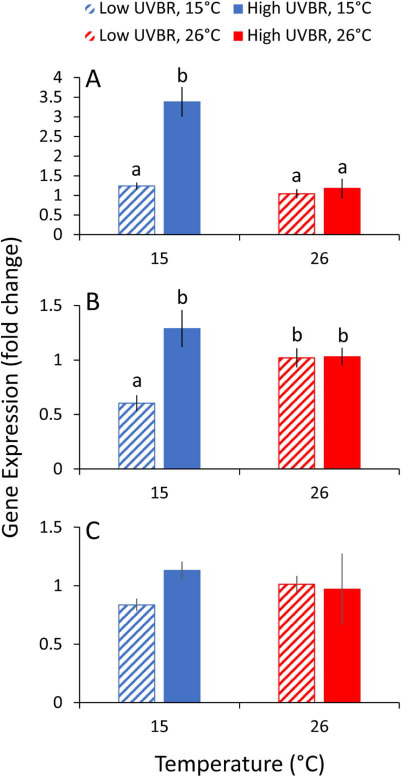
Figure 6.

Effect of 4 weeks of exposure to high (solid bars) and low (patterned bars) UVBR in combination with low (blue bars) and high (red bars) temperature on expression of (A) CPD photolyase, (B) 6-4 photolyase and (C) glucocorticoid nuclear receptor in whole-body L. peronii larva tissue, displayed as the fold change compared to the low UVBR, high temperature treatment (n = 5 to 6 per treatment; Experiment 1). Data are presented as means ± standard error. Lowercase letters above bars denote significant differences between treatments. Where no letters are presented, no significant differences were detected between treatments
