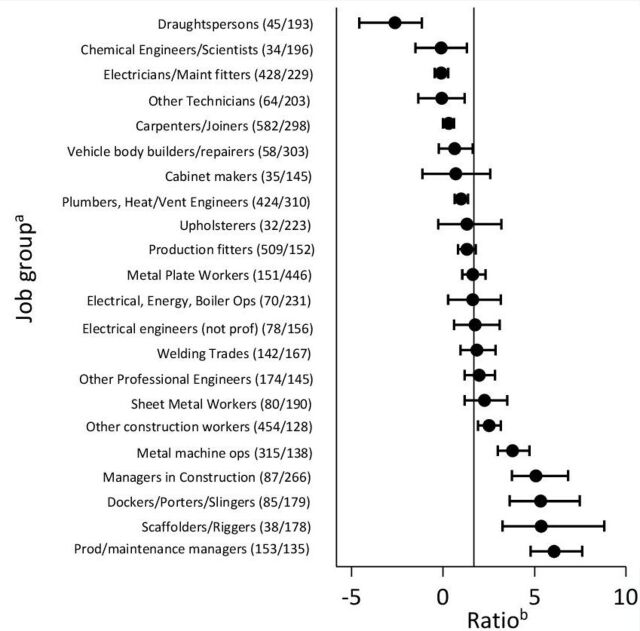
Figure 2.
Ratios of estimated excess deaths from lung cancer to observed deaths from cancer of pleura, 1979–1980 and 1982–2010. aFigures in brackets are observed numbers of deaths/corresponding PMRs for cancer of the pleura. bBars represent 95% CIs, and the vertical line indicates the average ratio across all 22 job groups of 1.69.

