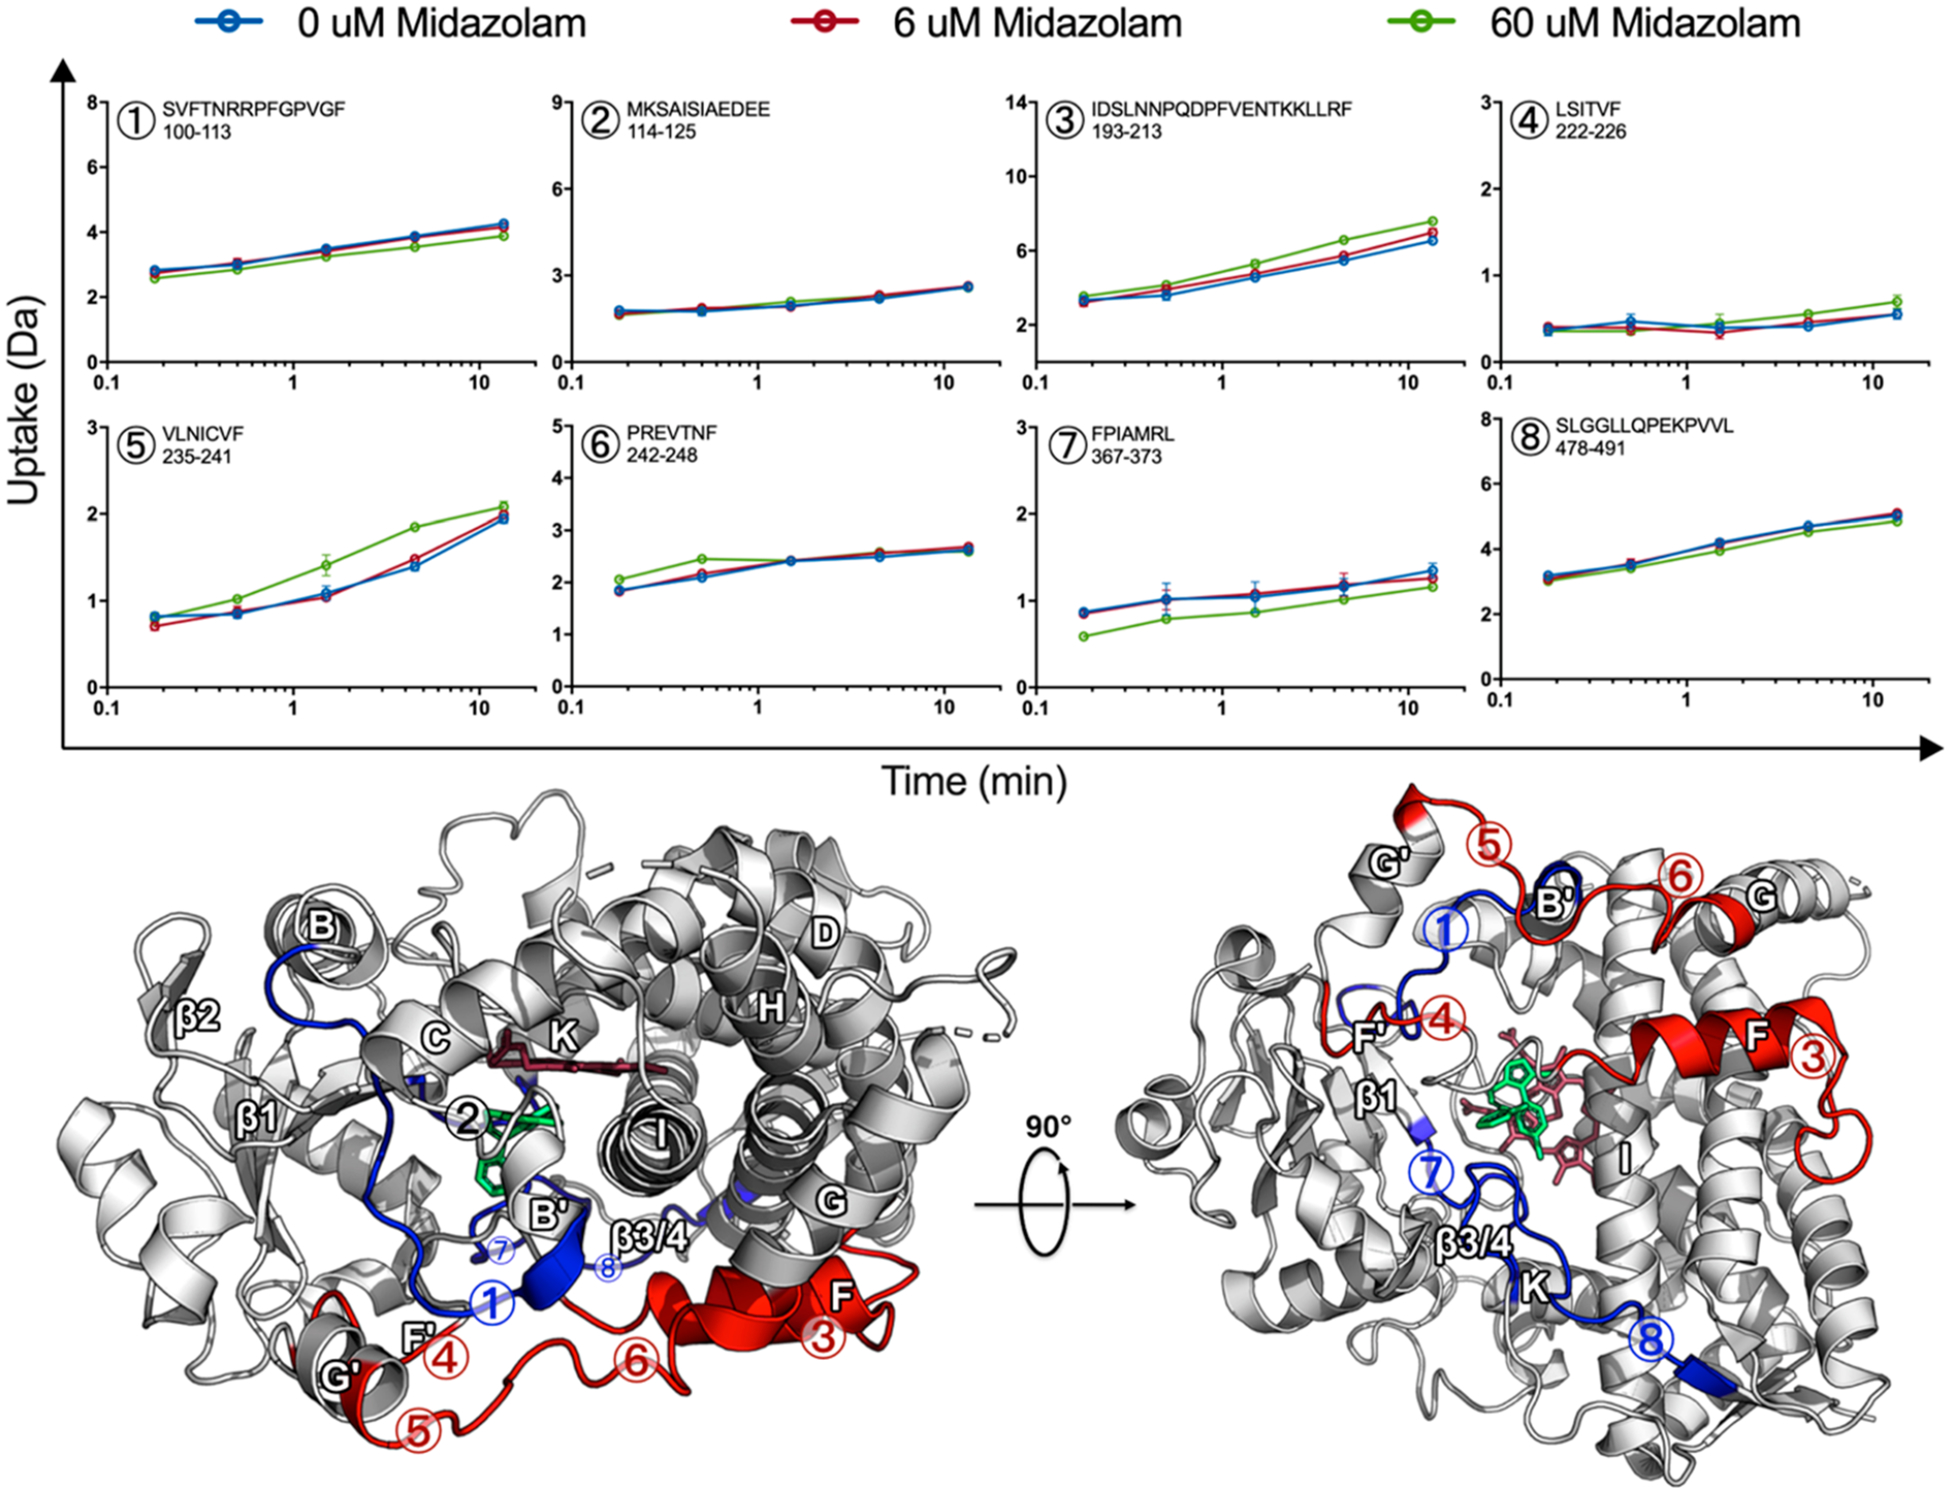
Figure 2.

MDZ-induced changes are globally distributed. Uptake plots for selected peptides, 0 μM MDZ (blue), 6 μM MDZ (red), and 60 μM MDZ (green) with error bars representing the standard deviation for duplicate measurements. Differences are mapped onto the MDZ-bound CYP3A4 crystal structure (PDB ID: 5TE8), where the MDZ-induced increase and decrease in HDX for the 60 μM MDZ state are highlighted red and blue, respectively. Regions where no change was observed in HDX are highlighted in tan or white, while regions with no data are highlighted in black. The heme and MDZ are shown by stick representation in dark red and green, respectively.
