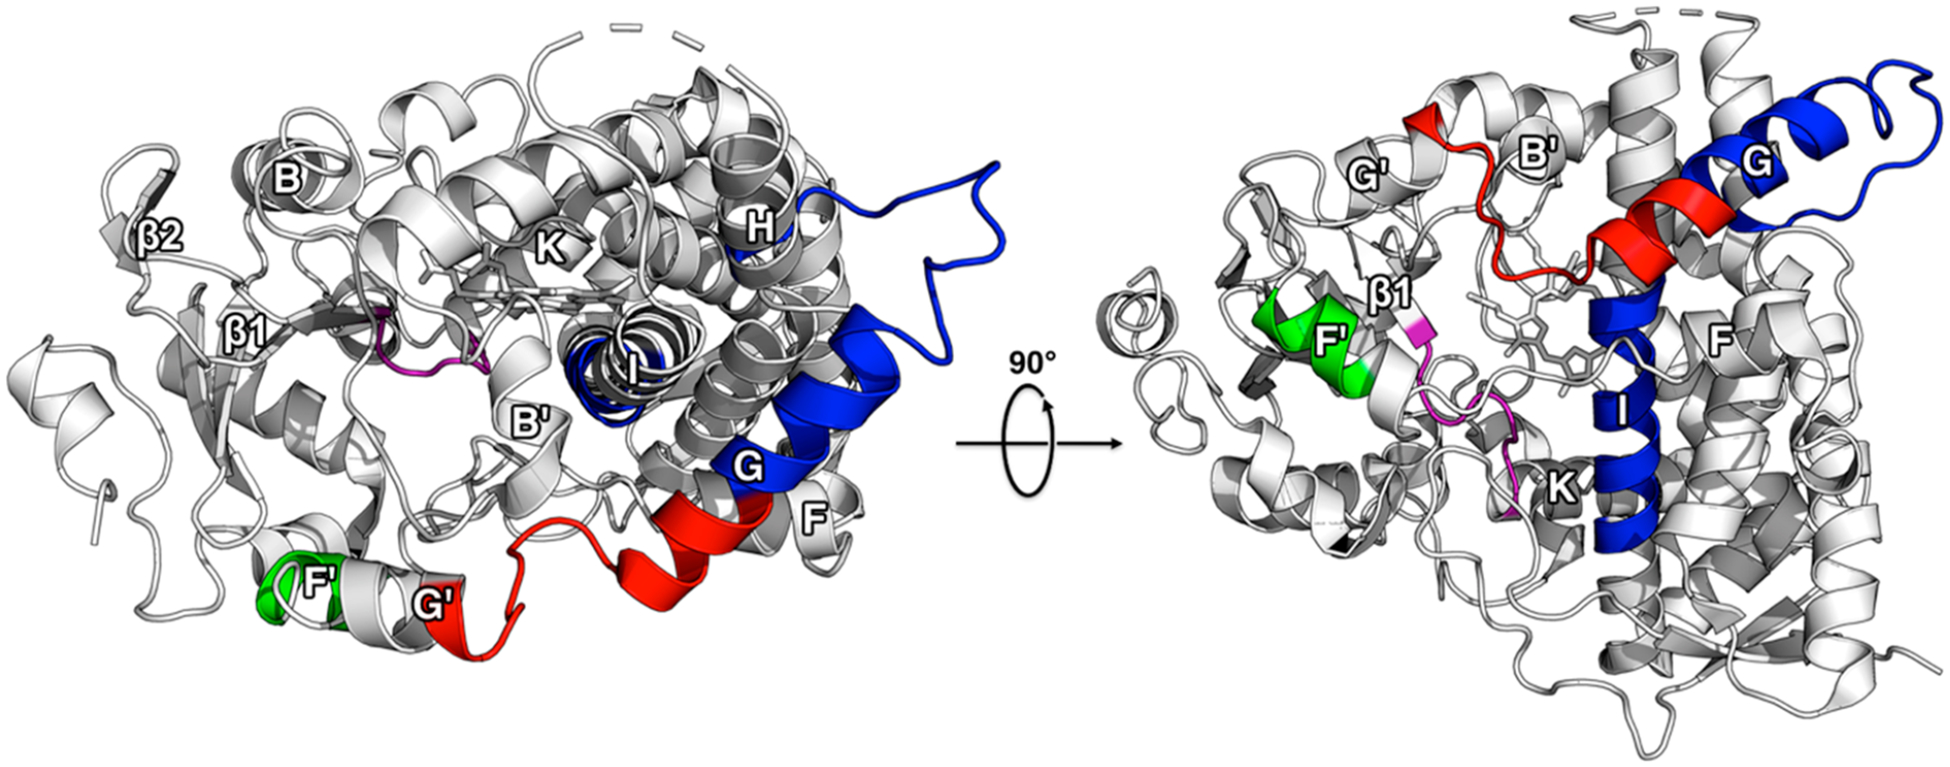
Figure 7.

Comparison of HDX changes from MDZ and KTZ binding. The changes are mapped onto the ligand-free crystal structure of CYP3A4 (PDB ID: 1TQN). Regions where KTZ binding induces a decrease in HDX relative to ligand-free CYP3A4 are highlighted in blue, green, and purple. Regions where MDZ binding induces an increase in HDX relative to ligand-free CYP3A4 are highlighted in red and green, while regions where a decrease in HDX occurs are highlighted in purple.
