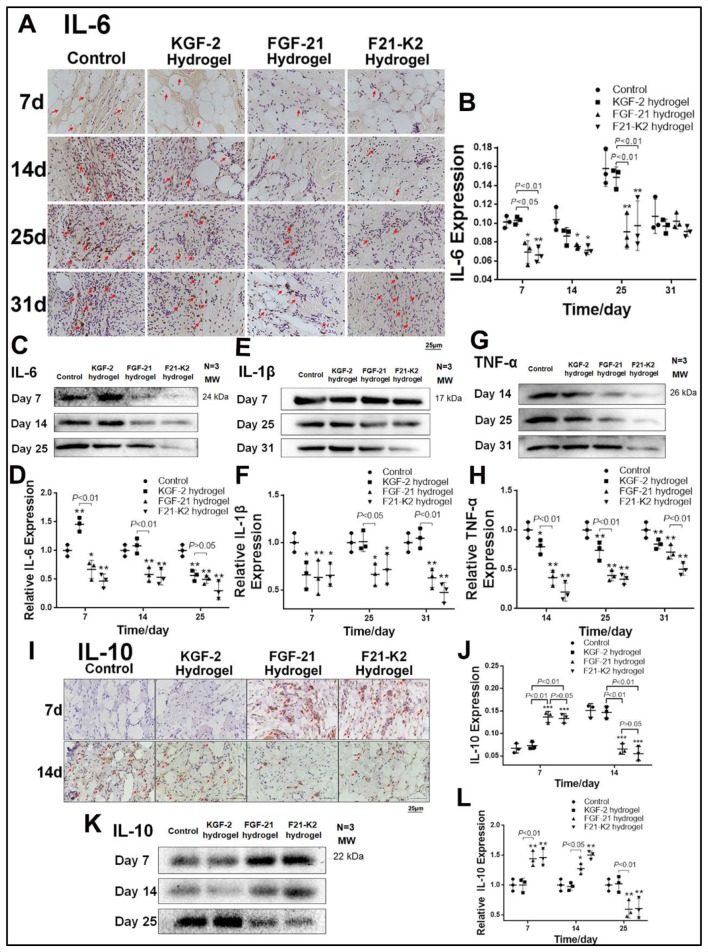
Figure 5.
Expression of pro-inflammatory factors IL-6, IL-1β, TNF-α and anti-inflammatory factor IL-10. (A) Immunostaining of IL-6 in dermis (red arrow indicates IL-6 positive object, scale bar: 25 µm). (B) Statistical analysis of IL-6 expression measured with IHC in dermis (n=3). (C, E, G) Western blot of IL-6, IL-1β and TNF-α in wound section, respectively. (D, F, H) Statistical analysis of IL-6, IL-1β and TNF-α expression measured with Western blot, respectively. (I) Immunostaining of IL-10 in dermis on days 7 and 14 (red arrow indicates IL-10 positive object, scale bar: 25 µm). (J) Statistical analysis of IL-10 expression by IHC in dermis (n=3). (K) Western blot of IL-10 in wound section on days 7, 14 and 25. (L) Statistical analysis of IL-10 expression measured with Western blot (n=3). Compared with the control group, *p<0.05, **p<0.01. FGF-21, fibroblast growth factor-21; F21–K2, FGF-21 and KGF-2; IL, interleukin; KGF-2, keratinocyte growth factor-2; TNF-α, Tumor necrosis factor alpha.

