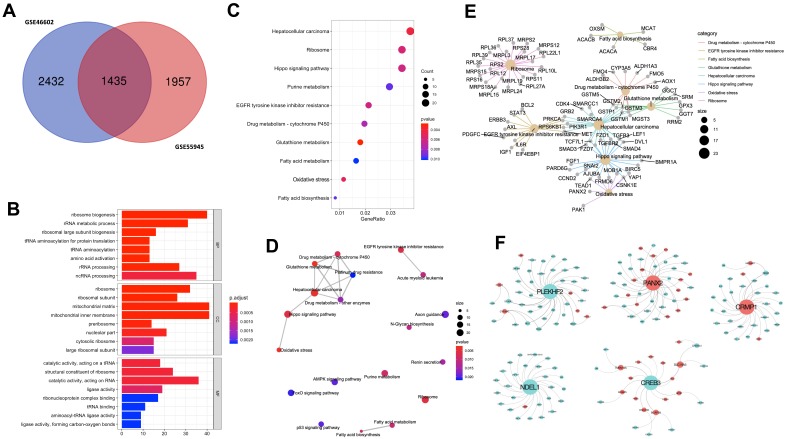
Figure 2.
Functional enrichment of common DEGs between two GEO microarray expression profiles. (A) Shows the intersection of GSE55945 and GSE46602. (B) Significant GO enrichment results are exhibited. (C) Significantly changed pathways are displayed. (D) Significantly changed pathways are connected to display their interactions. In this network, the circle size is directly proportional to the weighted degree of connectivity. (E) The association between significantly changed pathways and DEGs. Circle size represents the number of connections between gene and pathway. (F) Five most significant modules obtained from the PPI network. Red nodes denote up-regulated genes, and green nodes indicate down-regulated genes. Size of the node is directly proportional to the weighted degree of connectivity.

