Figure 6.
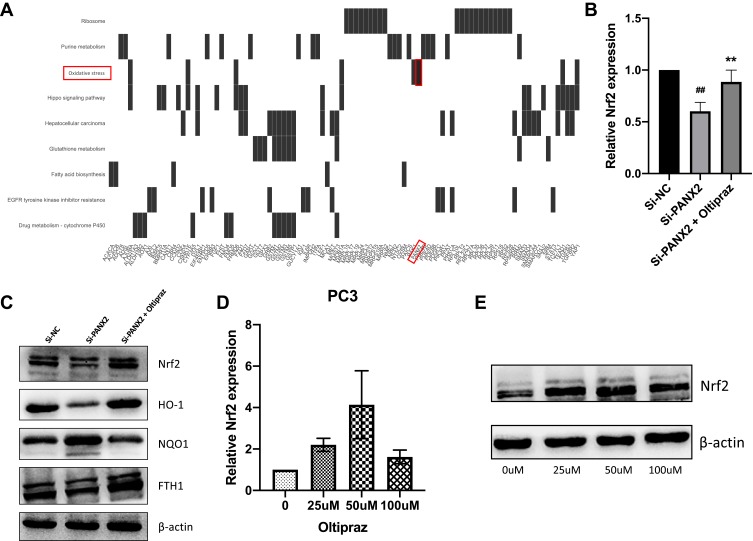
Analysis of Nrf2 signaling pathway. (A) A heatmap indicating the relationship between relevant pathways and corresponding DEGs. (B) Detection of expression levels of Nrf2 in PC3 cell lines transfected with si-PANX2 or si-NC using qRT-PCR. (C) Western blotting image analysis indicating reduction in expression levels of Nrf2 and its downstream members (HO-1 and FTH1) after silencing PANX2. (D, E) Selection of optimal concentrations of oltipraz. (##p<0.01; **p<0.01).

