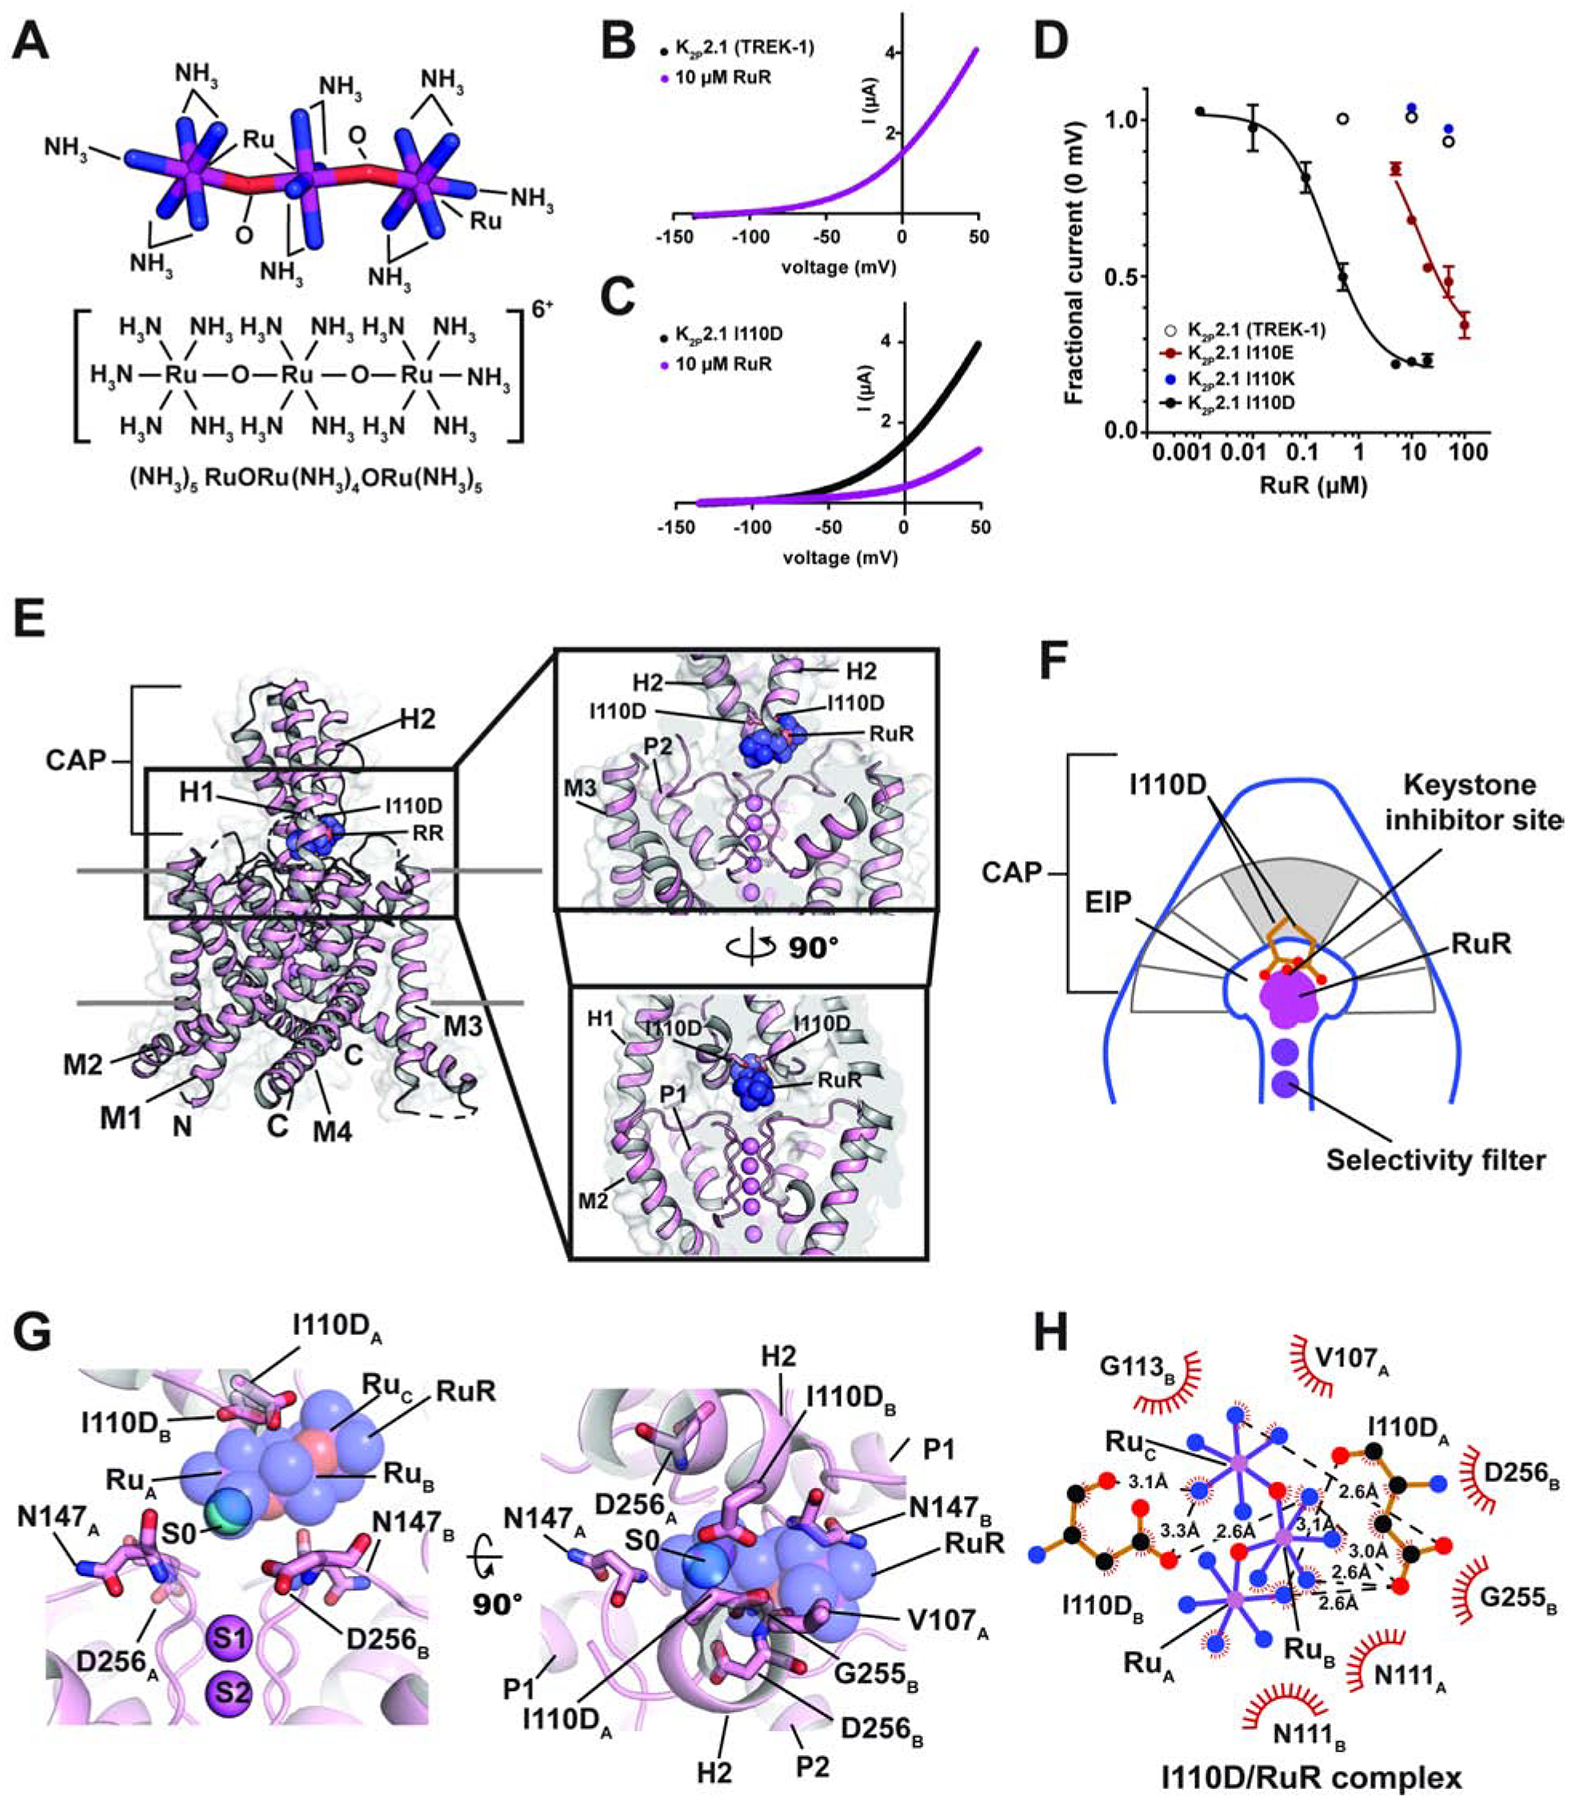
Figure 1. Functional and structural analysis of the K2P2.1 I110D:RuR complex.

(A) Ruthenium Red (RuR) structure. (B) and (C) Exemplar TEVC recordings of (B) K2P2.1 (TREK-1) and (C) K2P2.1 I110D responses to 10 μM RuR (magenta). (D) Dose-response curves for K2P2.1 (TREK-1) (open white circles), K2P2.1 I110D (black), K2P2.1 I110E (red), and K2P2.1 I110K to RuR. (E) Structure of the K2P2.1 I110D:RuR complex. Inset shows the location of the RuR binding site. I110D is shown as sticks. (F) Cartoon depicting the Keystone inhibitor site. View is from the lower panel of ‘E’. The archway formed by the CAP is diagramed in grey. The keystone position is shaded. (G) Close up view of K2P2.1 I110D:RuR interactions. S0 ion (cyan) from the K2P2.1 I110D structure is indicated. Subscripts indicate Chain A and Chain B residues. RuR is shown in space filling in panels (E) and (G). (H) LigPLOT (Wallace et al., 1995) diagram of K2P2.1 I110D:RuR interactions showing ionic interactions (dashed lines) and van der Waals contacts (red) ≤5Å. See also Figures S1 and S2 and Table S1 and S2.
