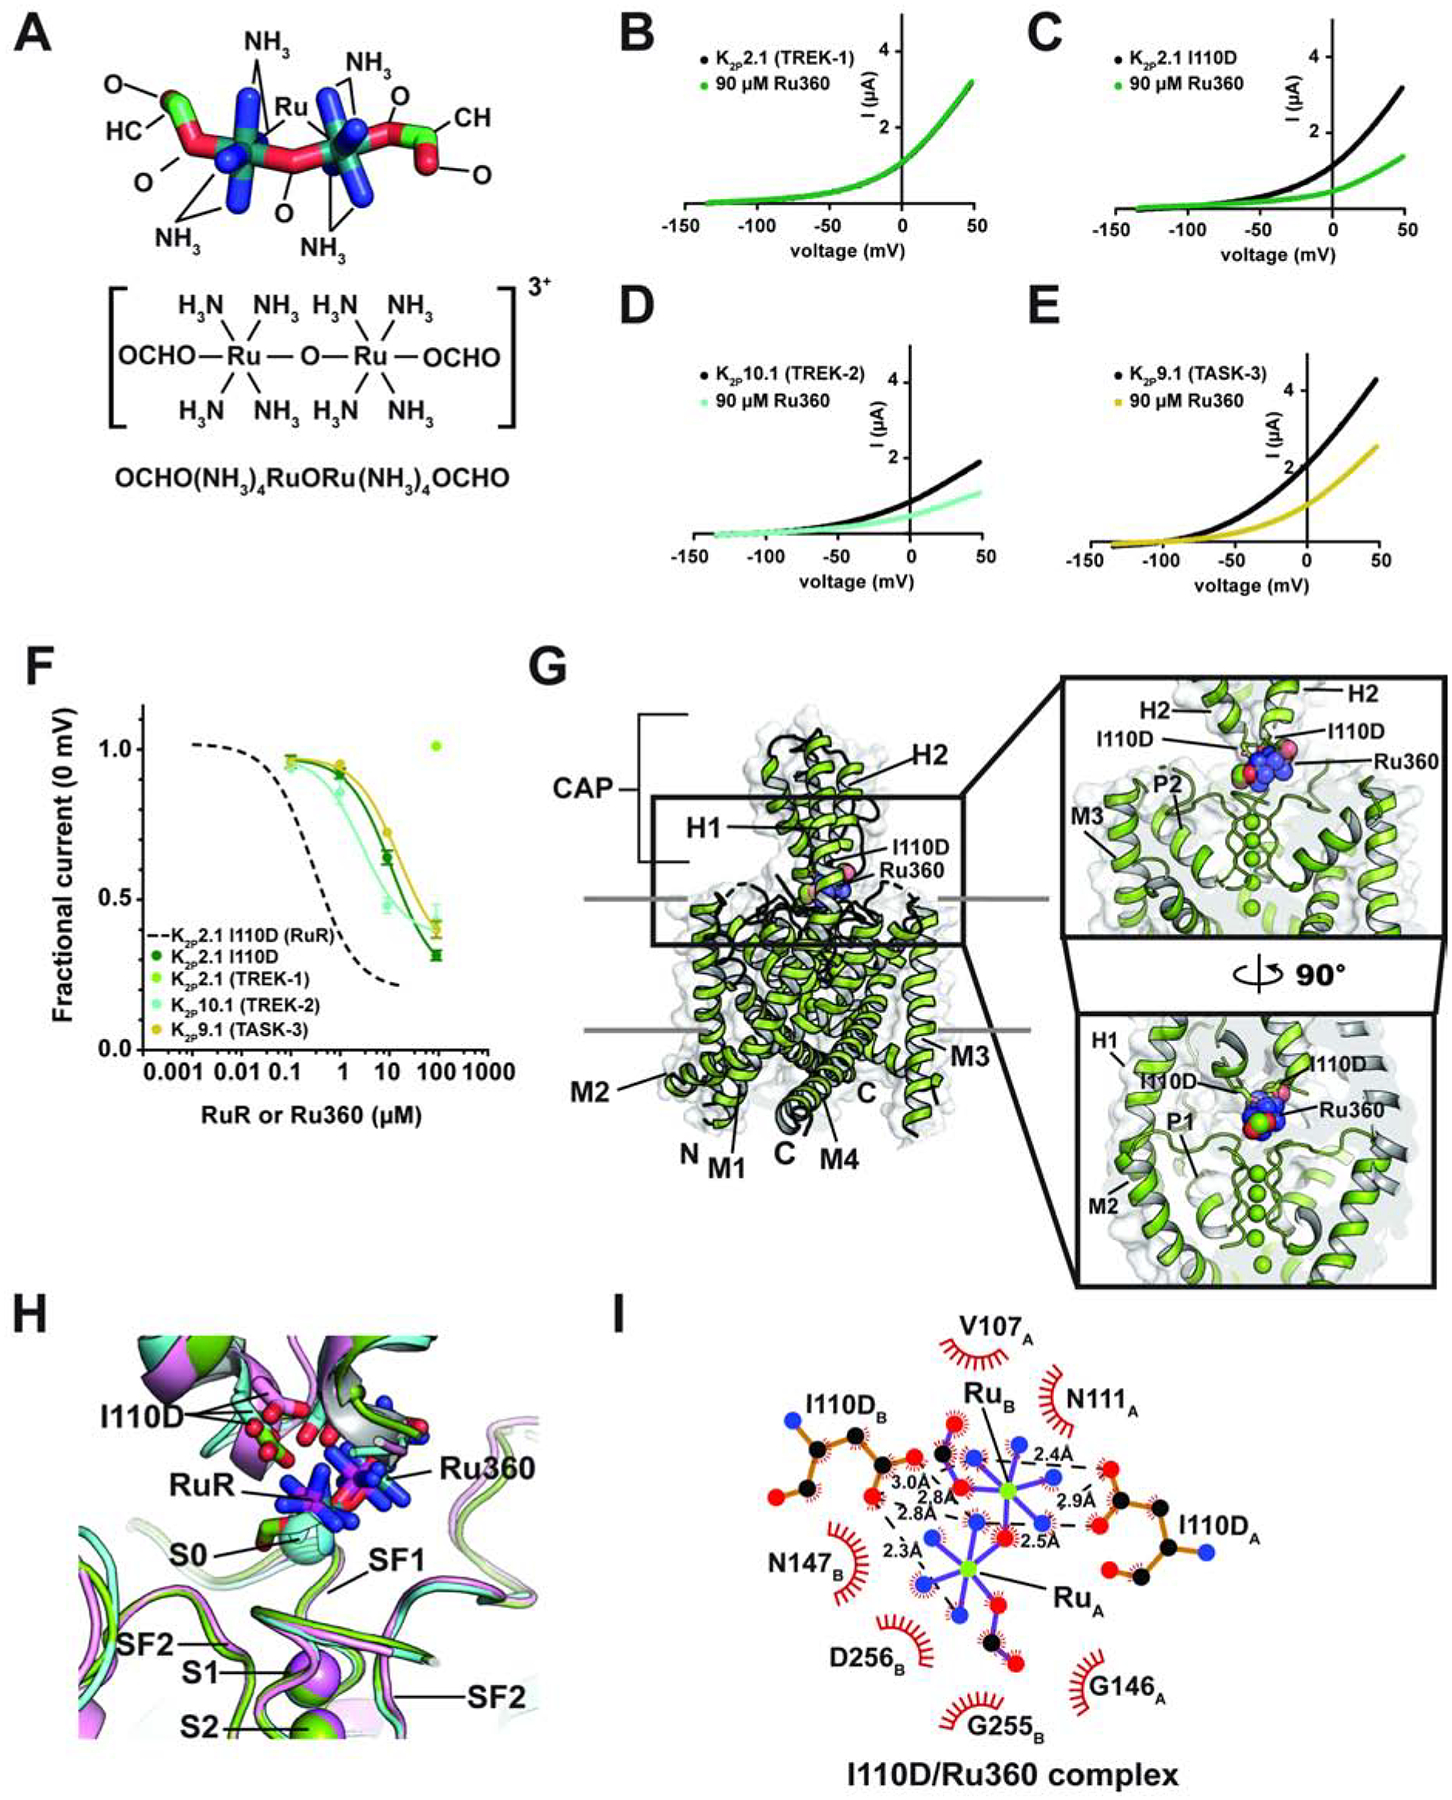
Figure 3. Functional and structural analysis of K2P:Ru360: interactions.

(A) Ru360 structure. (B–D) Exemplar TEVC recordings of (B) K2P2.1 (TREK-1), (C) K2P2.1 I110D, (D) K2P10.1 (TREK-2), and (E) K2P9.1 (TASK-3) alone (black) and in the presence of 90 μM Ru360 (green, teal, and olive, respectively). (F) Ru360 dose-response curves for K2P2.1 I110D (green), K2P2.1 (TREK-1) (light green), K2P10.1 (TREK-2) (teal), and K2P9.1 (TASK-3) (olive). Dashed line shows RuR dose-response for K2P2.1 I110D from Figure 1D. (G) Structure of the K2P2.1 I110D:Ru360 complex. Inset shows the location of the Ru360 binding site. I110D is shown as sticks. (H) Close up view of K2P2.1 I110D (cyan), K2P2.1 I110D:RuR (pink), and K2P2.1 I110D:Ru360 Keystone inhibitor sites. RuR and Ru360 are shown as sticks. S0 ion from the K2P2.1 I110D structure is shown as a sphere. (I) LigPLOT (Wallace et al., 1995) diagram of K2P2.1 I110D:Ru360 interactions showing ionic interactions (dashed lines) and van der Waals contacts (red) ≤5Å. Subscripts indicate Chain A and Chain B residues. See also Figure S4 and Tables S1 and S2.
