
Figure 4. Engineering K2P RuR super-responders.
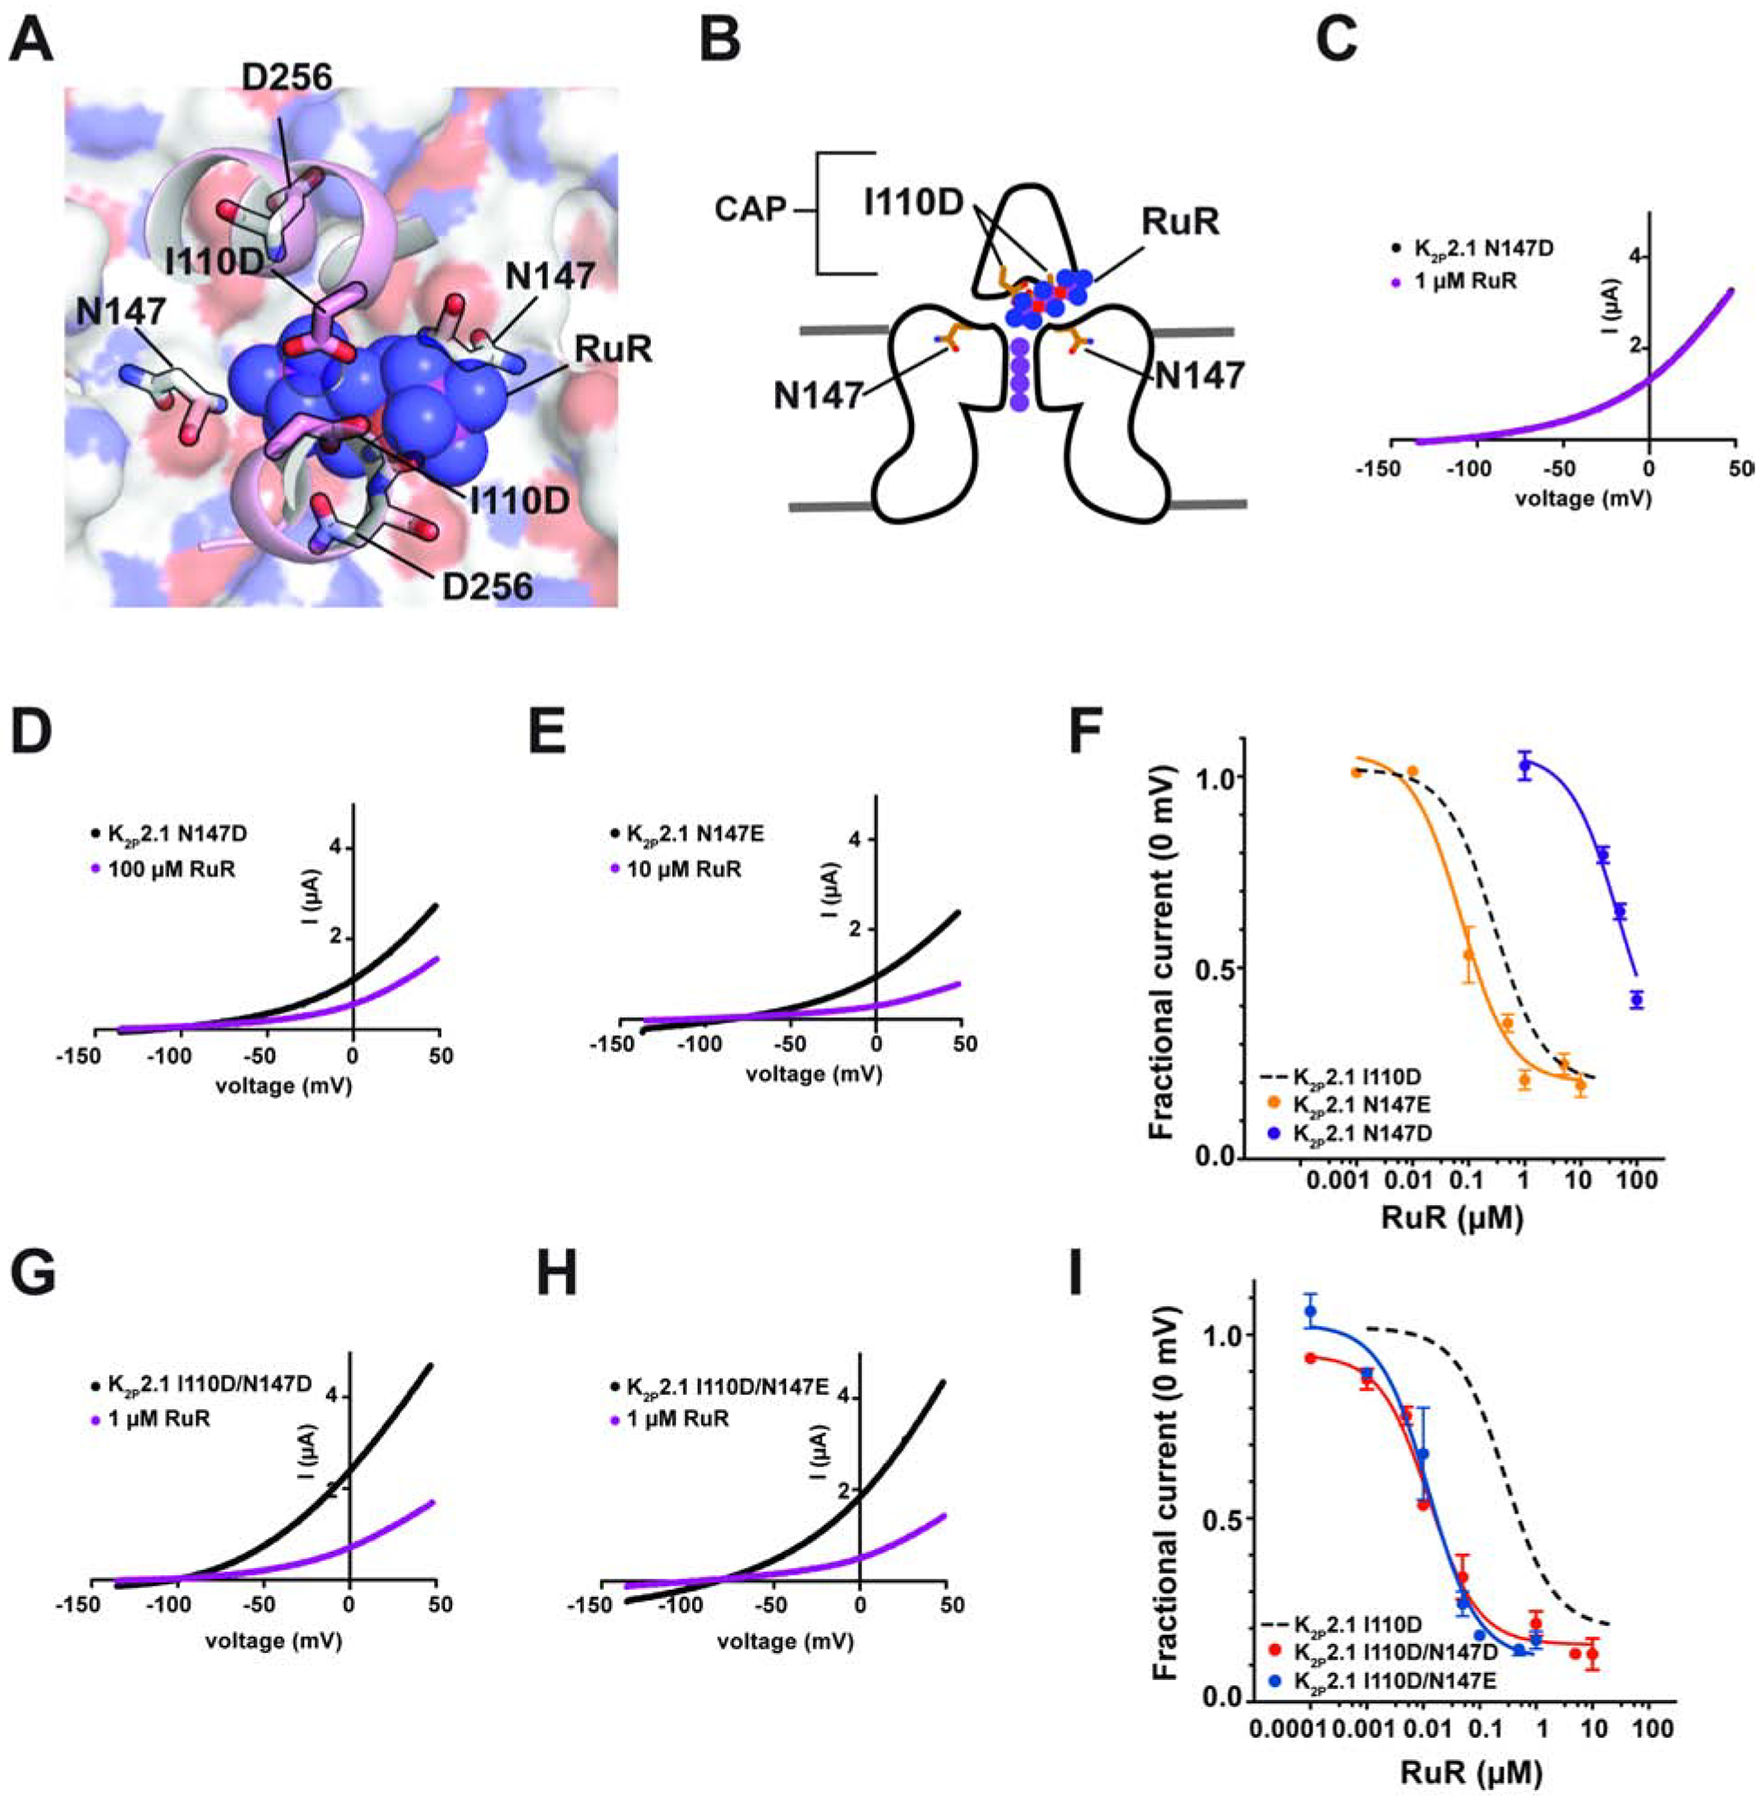
(A) View through the K2P2.1 (TREK-1) CAP to the floor of the Keystone inhibitor site. CAP H2 helix (pink) is shown as a cartoon. RuR is shown as semi-transparent spheres. Surface (white) shows the top of the selectivity filter. I110D, N147, and D256 are shown as sticks. (B) Cartoon depiction of the elements framing the Keystone inhibitor site. Locations of CAP, I110D, and N147 are indicated. Selectivity filter potassium ions are shown as purple circles. (C–E) TEVC recordings of (C) K2P2.1 N147D alone (black) and in the presence of 1 μM RuR (magenta), (D) K2P2.1 N147D alone (black) and in the presence of 100 μM RuR (magenta) and (E) K2P2.1 N147E alone (black) and in the presence of 10 μM RuR (magenta). (F) RuR response of K2P2.1 N147D (purple) and K2P2.1 N147E (orange). Dashed line shows K2P2.1 I110D response to RuR, from Figure 1D. (G) and (H) TEVC recordings of (G) K2P2.1 I110D/N147D alone (black) and in the presence of 1 μM RuR (magenta), and (H) K2P2.1 I110D/N147E alone (black) and in the presence of 1 μM RuR (magenta). (I) RuR dose-response of K2P2.1 I110D/N147D (red) and K2P2.1 I110D/N147E (blue). Dashed line shows K2P2.1 I110D response to RuR, from Figure 1D. See also Figures S5 and S6