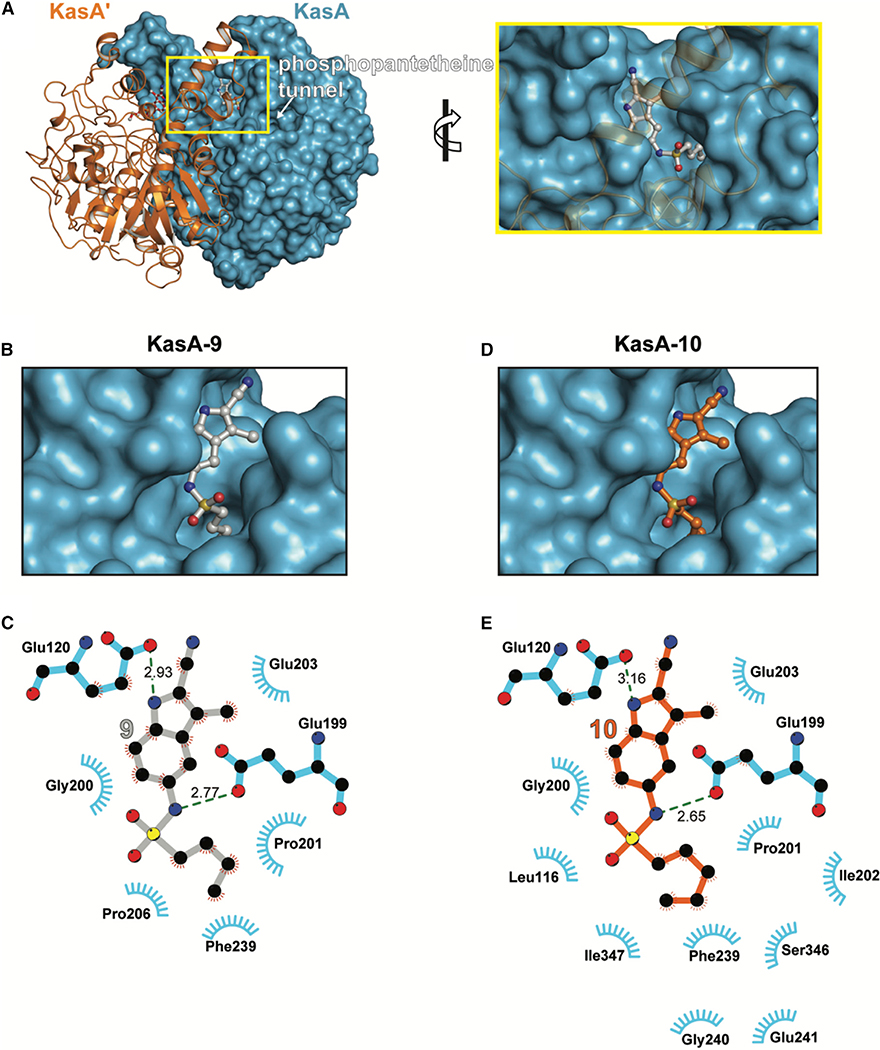
Figure 2. X-Ray Crystal Structures of KasA-Compound 9 and KasA-Compound 10.
(A) Left: KasA dimer with one protomer (KasA) rendered as a blue surface and the other protomer (KasA′) rendered as an orange cartoon. The compound 9 molecules are shown as ball and stick models with the sticks colored gray (9A) and red (9B′). Right: expanded view of area enclosed in the yellow rectangle in the left panel.
(B) KasA binding a single molecule of compound 9.
(C) Schematic representation of KasA-compound 9 interactions.
(D) KasA binding a single molecule of compound 10.
(E) Schematic representation of KasA-compound 9 interactions. Molecules are labeled consistently throughout (B–D). KasA is depicted as either a cyan surface or sticks. Compound 9 is depicted as either gray balls-and-sticks or bonds. Compound 10 is depicted as orange balls-and-sticks or bonds. Hydrogen bonds are depicted as dashed lines measured in angstroms. The blue semicircles with radiating lines represent hydrophobic contacts mediated by KasA residues. The interaction schematics in (C) and (E) were produced with LIGPLOT.

