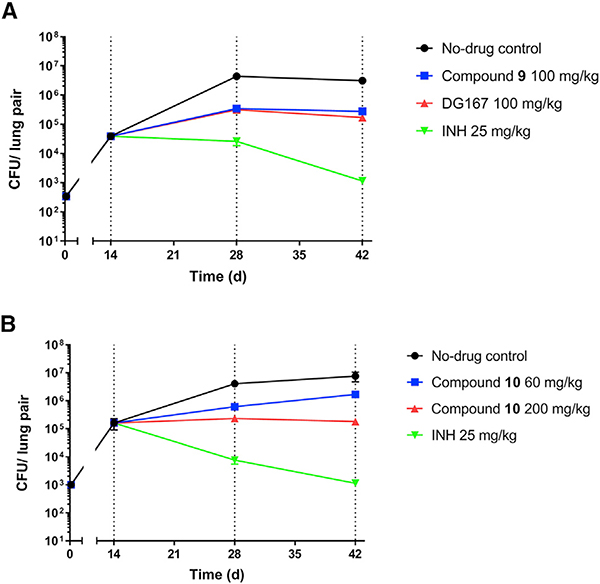
Figure 3. Efficacy Studies of Compound 9 at 100 mg/kg and Compound 10 at 60 or 200 mg/kg with Regard to Bacterial Lung Burden.
Controls were vehicle only, DG167 (100 mg/kg), and INH (25 mg/kg). Drug treatment with (A) compound 9 or (B) compound 10 began at day 14. All dosing was po qd (once daily). Each time point for each treatment represents an average from the sampling of the lungs of five mice. Error bars represent the mean ± standard error. Ordinary one-way ANOVA with multiple comparisons displayed significant differences between vehicle control and all individual treatment groups on day 42. All comparisons showed p < 0.0001 except for compound 10 (60 mg/kg) with p = 0.0025. The comparison between pre- treatment (day 14) and day 42 also showed highly significant differences (p < 0.001). The data were plotted and analyzed using GraphPad Prism 8.1.2.

