
Fig. 3. Relationships between peak diameter of adipocytes (thigh) and adiposity measures in men and women.
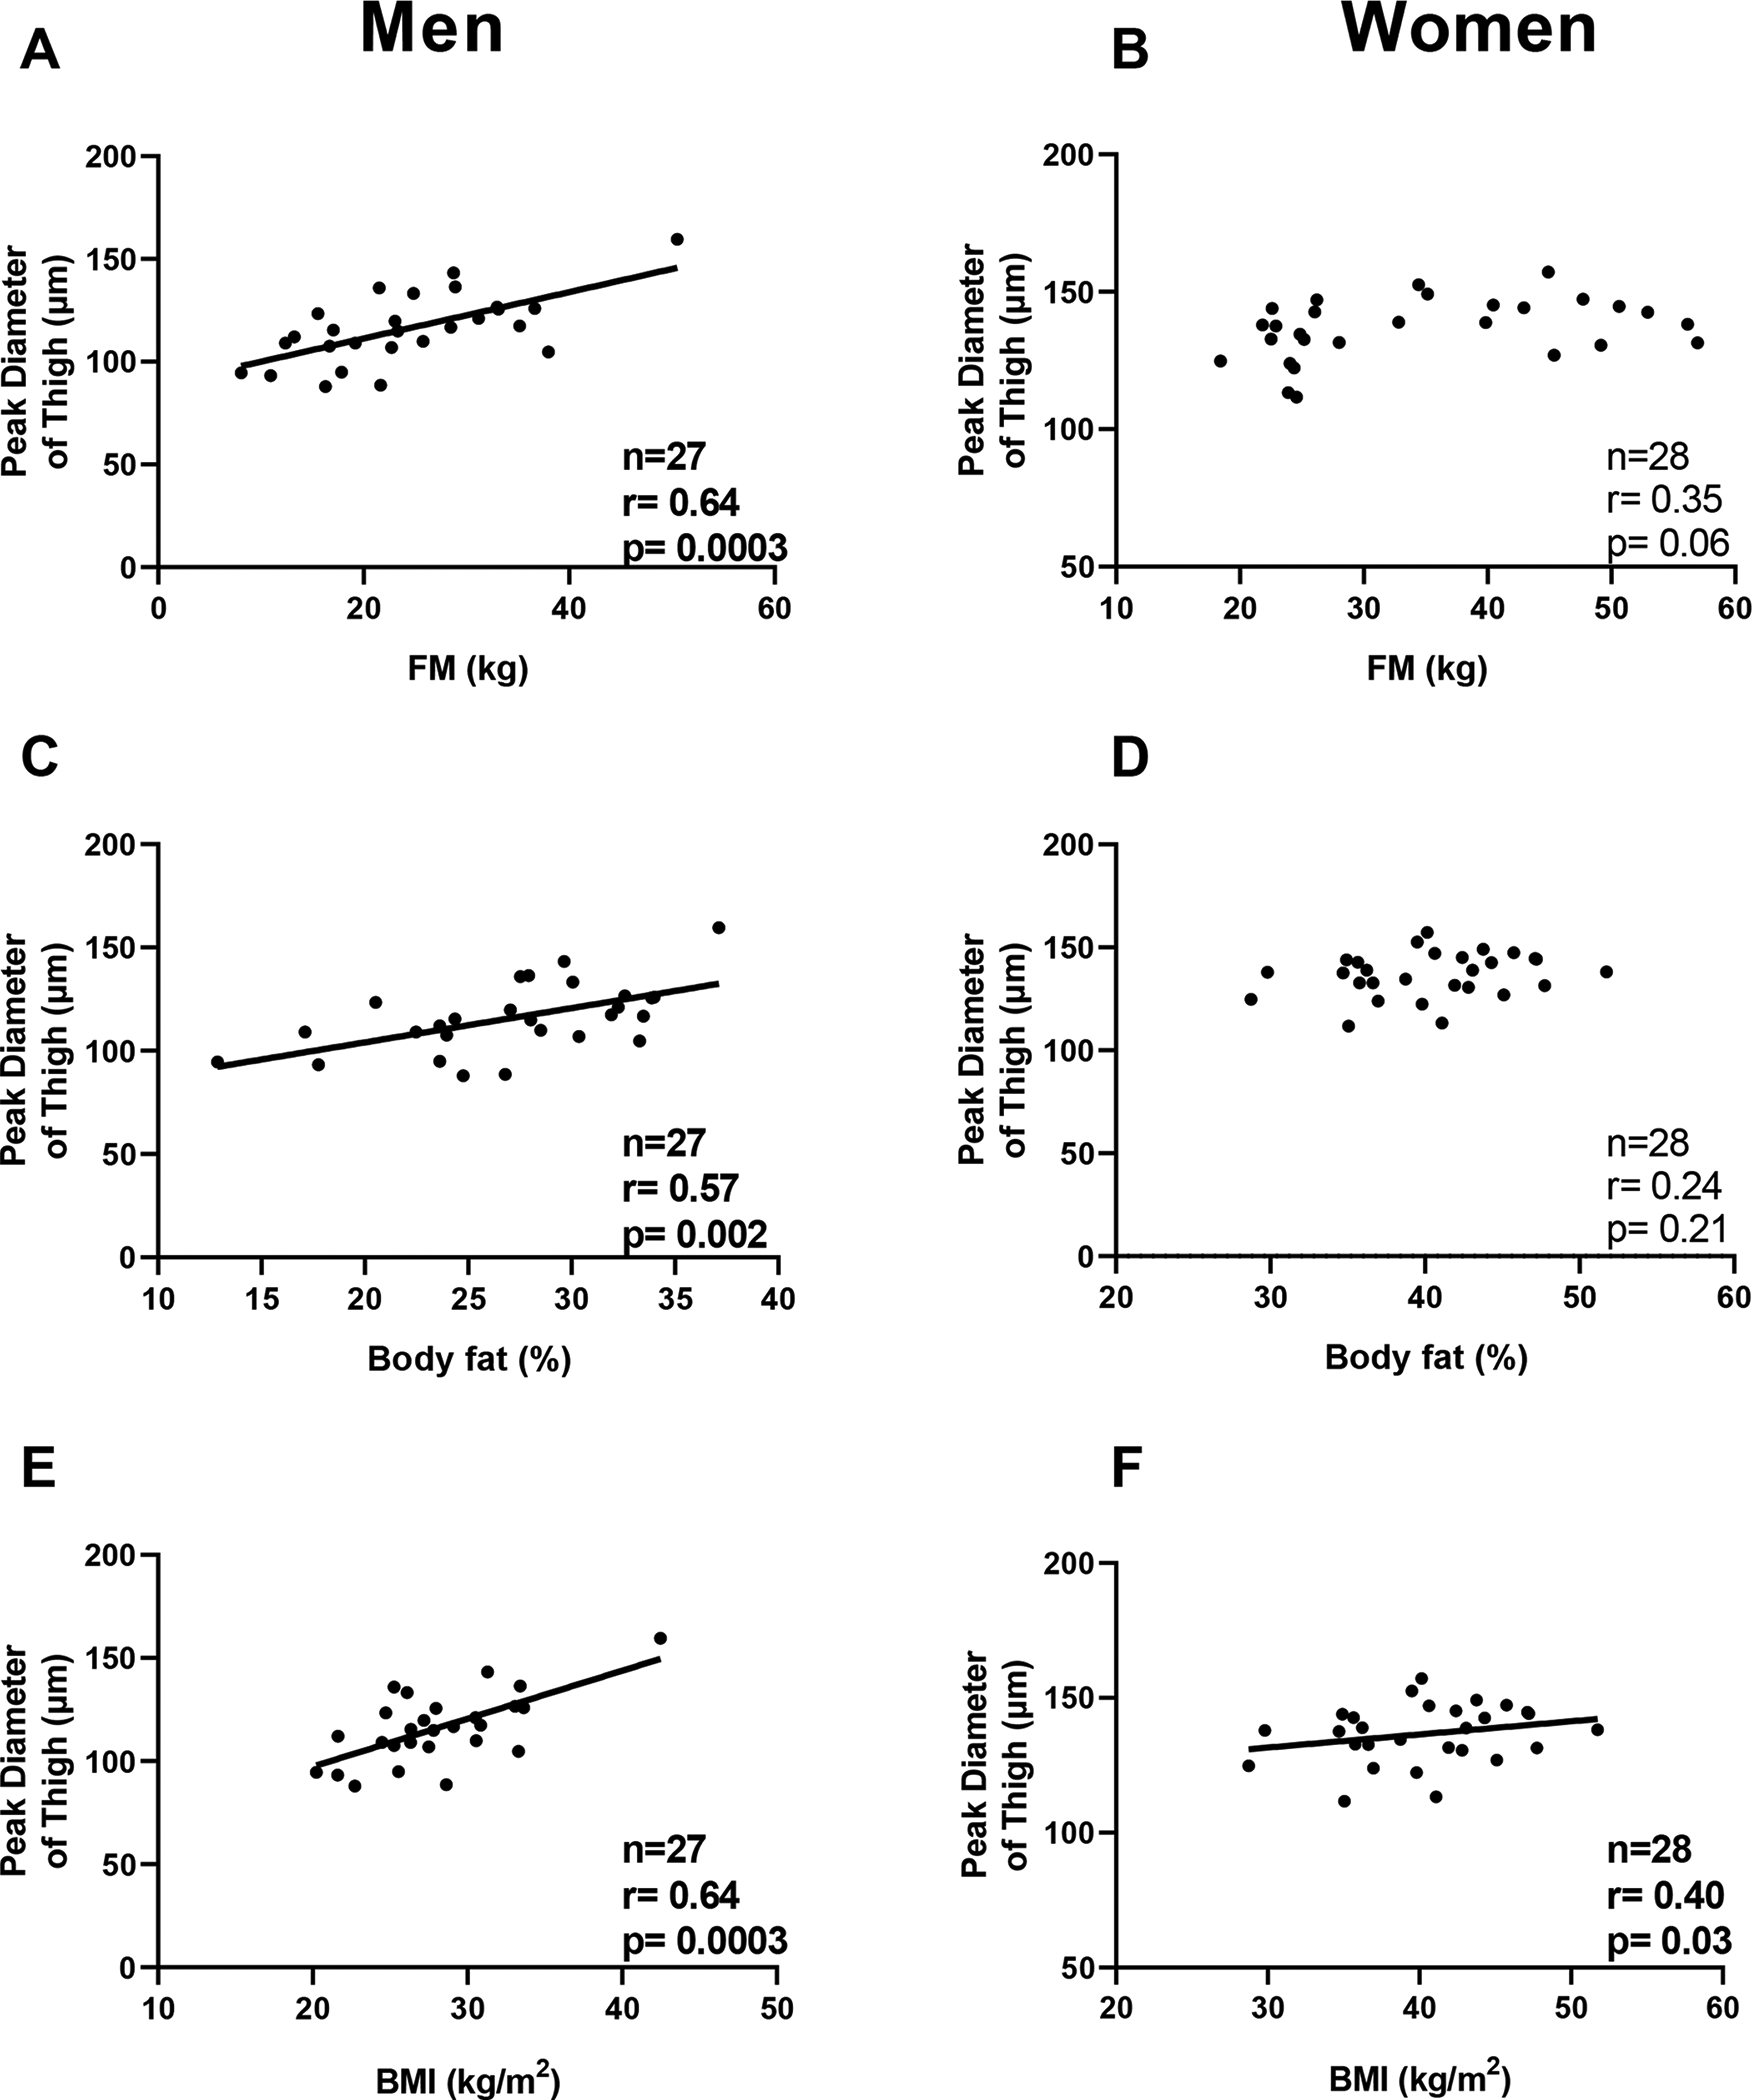
Panel A-C-E. Relationships between peak diameter of adipocyte size in the thigh and fat mass (panel A), body fat percentage (panel C), and body mass index (panel E) in men. Panel B-D-F. Relationships between peak diameter of the thigh adipocyte size and fat mass (panel B), body fat percentage (panel D), and body mass index (panel F) in women.
Pearson’s correlation coefficient (r) is reported along with its significance (p).