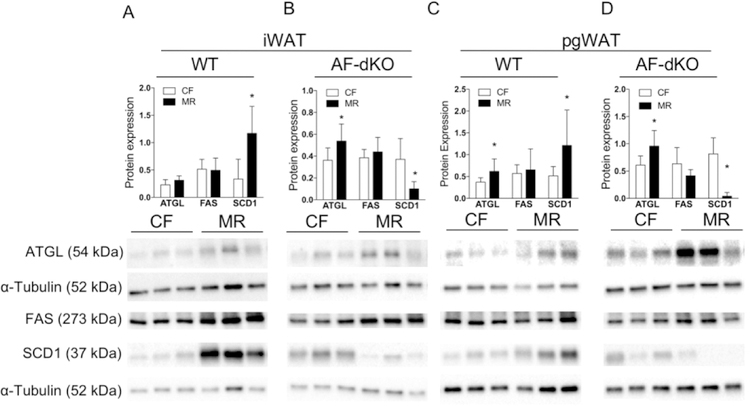
Figure 3.
Reduced fat mass in male obese mice during MR, lipolysis and hormone-regulated lipogenesis. Protein expression of ATGL, FAS and SCD1, normalized to α-tubulin and respective immunoblots in iWAT (A and B) and pgWAT (C and D) of WT DIO (A and C) and AF-dKO (B and D) mice fed CF (white bars) or MR (black bars). Statistical analysis was conducted using Student’s t-test between CF and MR in each cohort, as described in Methods (n = 7 – 8 / group, *P < 0.05).

