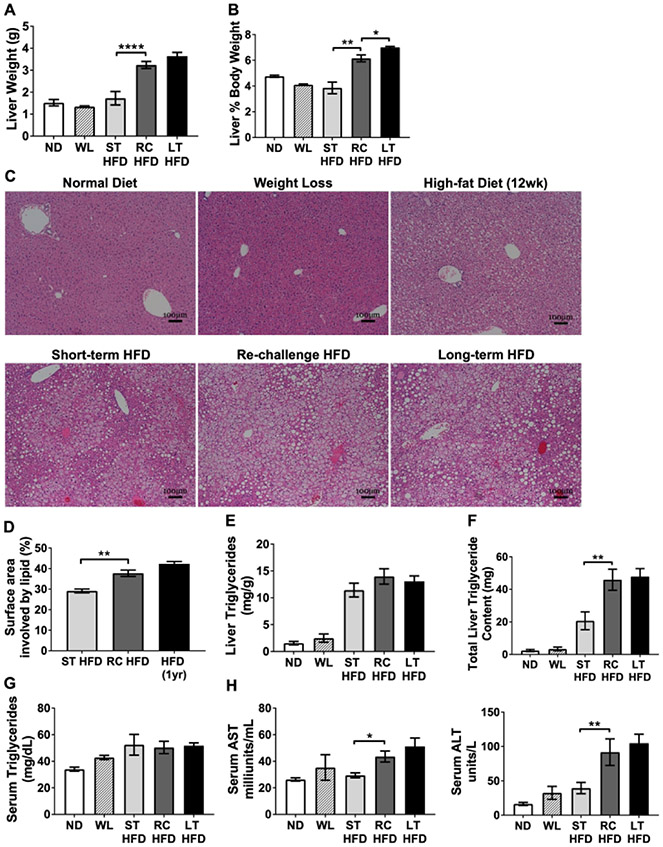
Figure 3 -. Increased liver steatosis and signs of liver damage with HFD re-challenge.
(A) Representative H&E stained slides from livers showing steatosis development and (B) percent of surface area with lipid involvement from H&E images (n ≥ 4). (C) Liver weight and (D) liver as a percent of total body weight (n = 4). (E) Liver triglyceride concentration and (F) total liver triglyceride content (n = 4). Serum concentrations for (G) triglyceride (n ≥ 4), (H) aspartate aminotransferase (AST, left; n =4), and alanine aminotransferase (ALT, right; n = 4). * p < 0.05, ** p < 0.01, **** p <0.0001, significance was only compared for ST-HFD versus RC-HFD, LT-HFD versus RC-HFD or ND versus WL.

