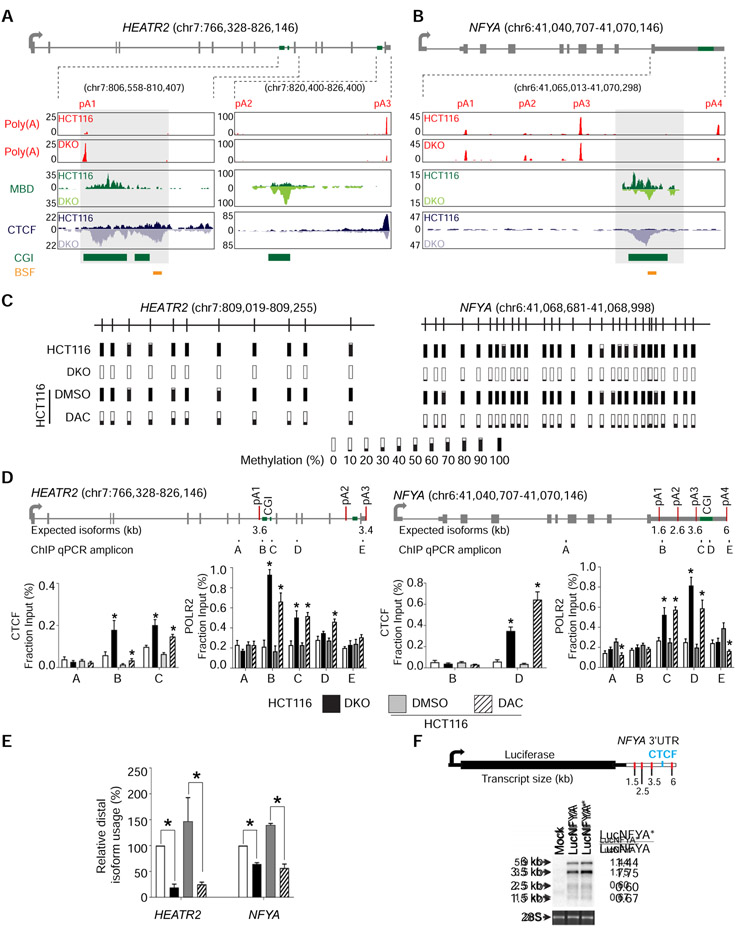
Figure 2: DNA methylation regulates APA via CTCF binding.
a, b, Gene model and UCSC genome browser views for HEATR2 (a) and NFYA (b). pA, poly(A) sites; Poly(A), poly(A)-seq; MBD, MBD-seq; CTCF, CTCF ChIP-seq; CGI, annotated CpG islands; BSF, bisulfite sequencing amplicons; boxed regions, differentially methylated CpG islands. c, Bisulfite sequencing of HEATR2 and NFYA in HCT116, DKO, and HCT116 after 72 hours of treatment with DMSO (DMSO) or DAC (DAC). Bars represent percent methylation at individual CpGs. d, ChIP-qPCR for CTCF and POLR2 at HEATR2 and NFYA. Gene models show exons (grey boxes), CpG islands (CGI; green boxes), and poly(A) sites (red lines). ChIP-qPCR amplicons are indicated below the gene model and labeled A-E. n = 3 biological replicates. *, p <0.05 for the difference between DKO and HCT116 or between DAC and DMSO. Data are represented as mean ± SEM. e, qRT-PCR to quantify poly(A) isoform expression at HEATR2 and NFYA in the same cells as in (d). All samples are normalized to HCT116. Data are represented as mean ± SEM. *, p <0.05. f, Northern blot detection of the luciferase reporter gene. The luciferase reporter construct containing NFYA 3′ UTR is shown with red lines indicating poly(A) sites and a blue line denoting the putative CTCF binding site. Mock, no construct; LucNFYA, wildtype NFYA 3′ UTR; LucNFYA*, CTCF-binding site mutant. 28S is a loading control. Normalized luciferase expression for each poly(A) isoform is on the right. See also Figure S2.

