Fig. 3.
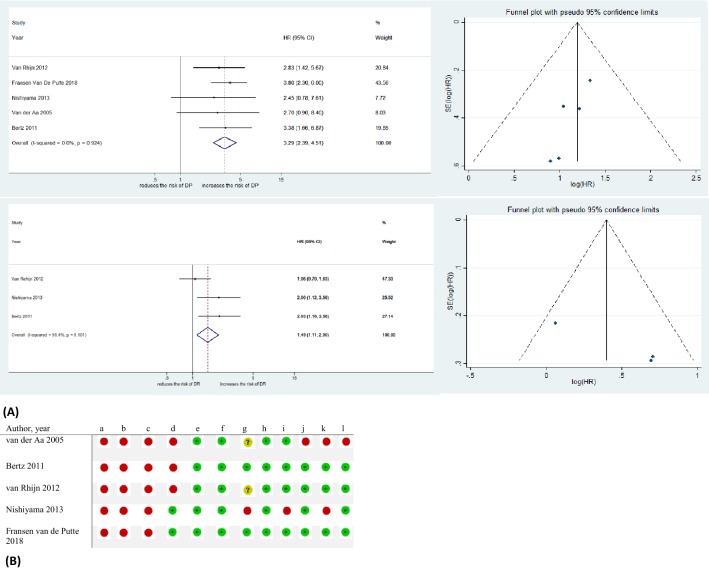
A Forest plots and funnel plot of studies investigating the association of T1 m/e substaging system with disease progression (DP) and disease recurrence (DR) outcomes. B T1 m/e substaging system RoB table, a Random sequence generation (selection bias). b Allocation concealment (selection bias). c Blinding of participants and personnel (Performance bias.). d Blinding of outcome assessment (detection bias). e Incomplete outcome data (attrition bias). f Selective reporting (reporting bias); and adjustment for the effects of the following confounders. g treatment modality. h tumor grade. i CIS. j Multifocality. k T1a/b/c substaging. l Tumor size. Green circles: low risk of bias and confounding, red circles: high risk of bias and confounding, yellow circles: unclear risk of bias and confounding. CI confidence interval, HR hazard ratio

