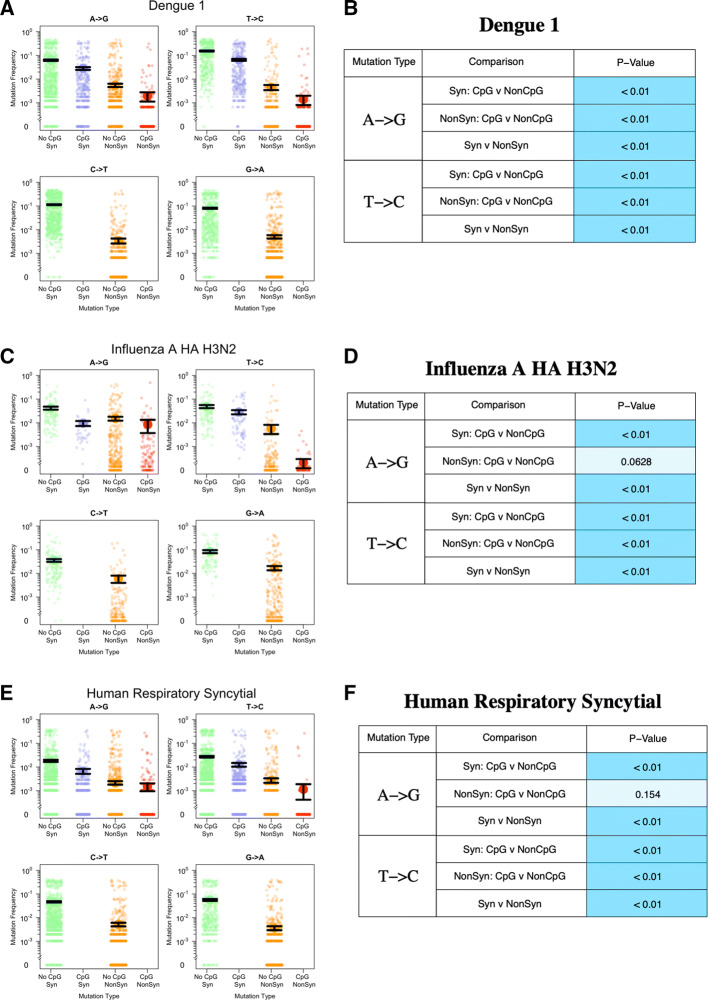
Fig. 3.
Observed transition mutation frequencies of CpG/non-CpG-creating mutations in select viral datasets (a the whole genome of Dengue 1 virus, c the HA gene of Influenza A virus H3N2, and e the glycoprotein gene of Human Respiratory Syncytial virus). Each figure on the left (a, c, e) displays transition mutation frequencies, with the mean and standard errors (black lines). The Wilcoxon test results are shown on the right (b, d, f). The shade of the blue color in the p value cell represents the significance level; darker the shade, the more significant the results are ( dark blue, 0.01–0.05 medium blue, light blue)

