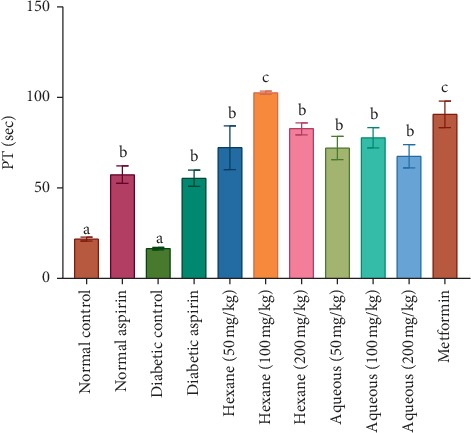
Figure 3.

Prothrombin time (PT) in diabetic rat treated with different concentrations of aqueous and hexane fractions of C. crepidioides. Bars with different letters are significantly different (n = 4); b is significantly higher than a (P < 0.001). c is significantly higher than a (P < 0.0001).
