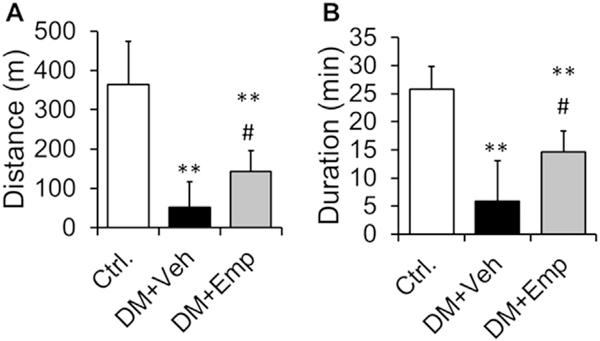
Fig. 3. Running distance and duration with treadmill exercise.
Running distance (A) and duration (B) were shown from non-diabetic control ALDH2 * 2 mutant mice (Ctrl.), vehicle-treated ALDH2 * 2 mutant diabetic mice (DM + Veh) and EMP-treated ALDH2 * 2 mutant diabetic mice (DM + EMP). Data are presented as mean ± standard error of the mean (S.E.M.). Data are presented as mean ± standard error of the mean (S.E.M.). **P < 0.001 vs. Ctrl.; #P < 0.05 vs. DM + Veh.

