Fig. 1.
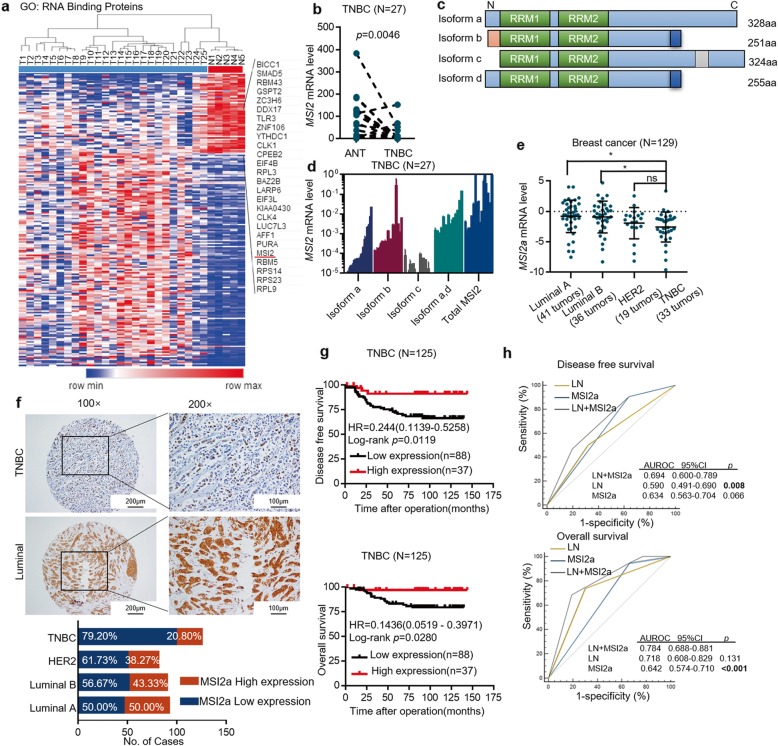
MSI2 downregulation in TNBC tissues and its association with poor TNBC prognosis. a Heatmap of differentially expressed mRNAs related to nucleotide binding between TNBC tissues and ANTs (> 1.5-fold and p < 0.05). b qRT-PCR. MSI2 mRNA expression levels in 27 pairs of TNBC and normal tissues. c Structure of the MSI2 isoforms. Isoform a is the canonical MSI2 isoform. The N- and C-termini of isoform b are distinct from those of isoform a. The N-terminus of isoform c lacks 4 aa compared with the N-terminus of isoform a. Isoform d contains the same N-terminus as isoform a and the same C-terminus as isoform b. d Expression analysis by qRT-PCR of MSI2 isoforms a-d mRNA in 27 TNBC tumor tissues. e qRT-PCR. MSI2a mRNA expression levels across different breast cancer types. f Immunohistochemistry. Representative tissue microarray cores of TNBC or luminal breast cancer samples after immunostaining with an anti-MSI2a antibody. Images were magnified with a 10× or 20× objective. Scale bar, 100 μm and 200 μm, respectively. g Kaplan-Meier survival curves comparing OS and DFS in patients stratified by low vs. high MSI2a mRNA levels in breast cancer tissues. h ROC curves of DFS and OS showing the area under the ROC curve (AUROC) of the combined MSI2a expression and lymph node (LN) status versus AUROCs of MSI2 expression alone or LN status alone

