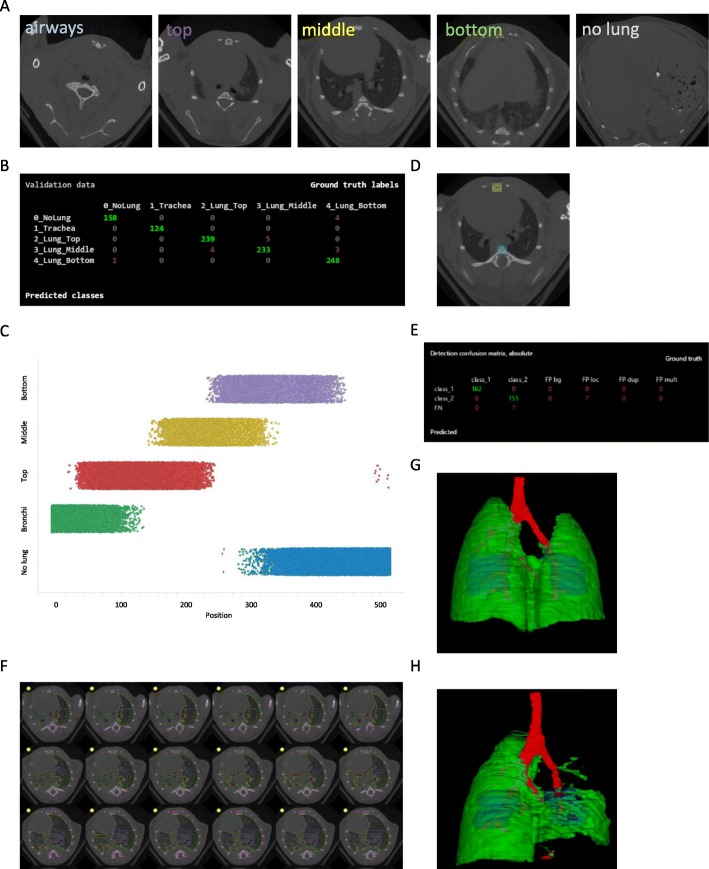
Fig. 2.
Model development for analysis of μCT data using a deep-learning approach.a Example images for the five classes used for finding slices in the “middle of the lung” and (b) a confusion plot to illustrate the classification performance. c Plot of lung type class versus position in the μCT stack. d Example image for the detection of breast (yellow square) and spine bone (blue square) used to fit the “biopsy” ROIs inside the chest cavity and e a confusion plot to illustrate the detection performance. f Representative μCT images from class “middle of the lung” with segmented tissue using the deep learning approach and the fitted two “biopsy” ROIs. Segmented μCT stack with lung tissue (green), airways (red) and ROIs (blue) of (g) a control and (h) a severely fibrotic lung

