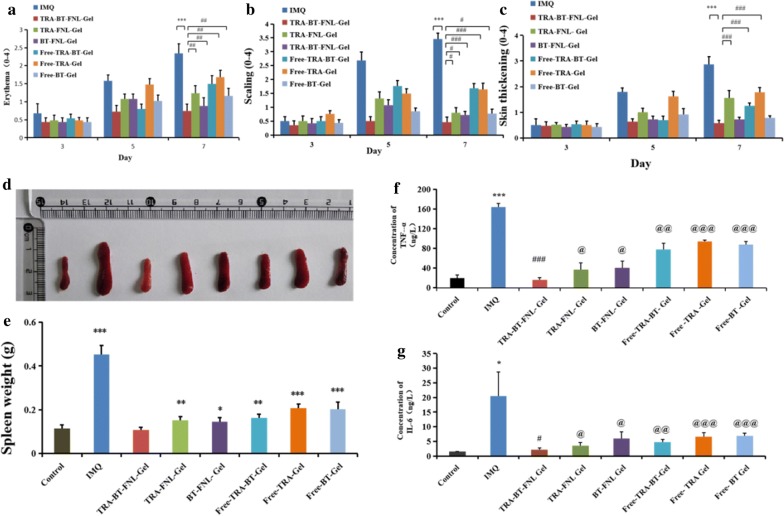
Fig. 8.
Anti-psoriasis pharmacodynamics. a PASI scoring for erythema; b PASI scoring for scaling; c PASI scoring for skin thickening (mean ± SD, n = 5; *p < 0.05, **p < 0.01, ***p < 0.001 compared with IMQ group; #p < 0.05, ##p < 0.01, ###p < 0.001 compared with TRA-BT-FNL-Gel group; d representative photos of spleens in different group; e the changes of spleen weight in different groups, (mean ± SD, n = 5; *p < 0.05, **p < 0.01, ***p < 0.001 compared with the weight of control group); f expression levels of TNF-α in different group,(g) Expression levels of IL-6 in in different group, (mean ± SD, n = 5; *p < 0.05, **p < 0.01, ***p < 0.001 compared with control group; #p < 0.05, ##p < 0.01, ###p < 0.001 compared with IMQ group, @p < 0.05, @@p < 0.01, @@@p < 0.001 compared with TRA-BT-FNL-Gel group

