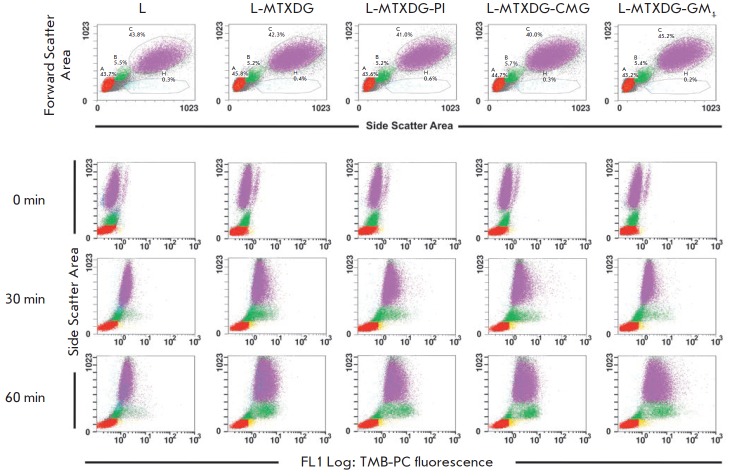
Fig. 2.
FACS histograms of blood samples after incubation with liposomes and erythrocyte lysis. Upper panel: distribution of peripheral blood cells in samples without liposomes; A, lymphocytes; B, monocytes; C, neutrophils; the area of dead cells is highlighted below. Panels 0, 30, 60 min: fluorescence of phagocytized liposomes “gated” by subpopulations of leukocytes after incubations for 0, 30, 60 min (a dye was added to quench the fluorescence of the liposomes adsorbed on the surface of cells; yellow zones are cells with incompletely quenched liposome fluorescence on the surface). TMB-PC liposomes of the following compositions were used: ePC (sample L); ePC–MTXDG, 9 : 1 (sample L-MTXDG); ePC–MTXDG–PI, 8 : 1 : 1 (sample L-MTXDG-PI ); ePC–MTXDG–CMGPE, 8 : 1 : 1 (sample L-MTXDG- CMG), ePC–MTXDG–GM1, 8 : 1 : 1 (sample L-MTXDG-GM1)

