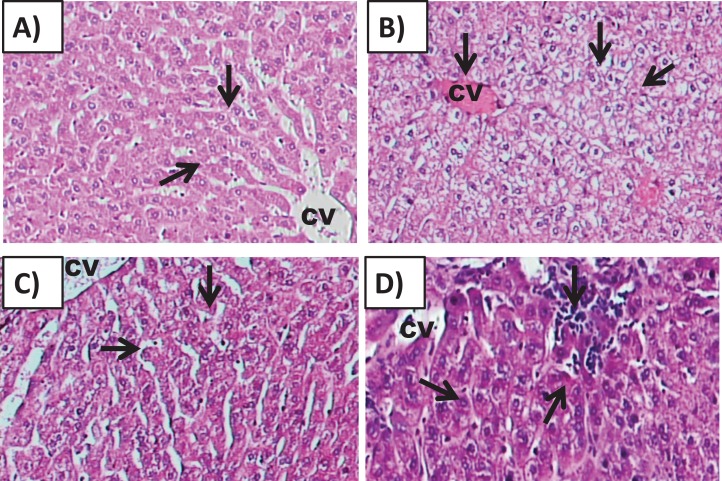
Figure 6. Effects of amygdalin on the histology of the hepatic tissue of mice.
(A) Hepatic tissue of Group I (control) showing normal architecture, with normal hepatocytes in the hepatic cords (black arrows) and central vein (CV) (H&E, ×100). (B) Hepatic tissue of Group II (200 mg/kg) showing vascular congestion (black arrow), Kupffer cell activation, marked cytoplasmic vacuolization, and binucleated hepatocytes (black arrow) (H&E, ×100). (C) Hepatic tissue of Group III (100 mg/kg) showing normal hepatocytes and central vein (H&E, ×100). (D) Hepatic tissue of Group IV (50 mg/kg) showing normal histological features with mild inflammatory cell infiltration (red arrow) (H&E, ×100).

