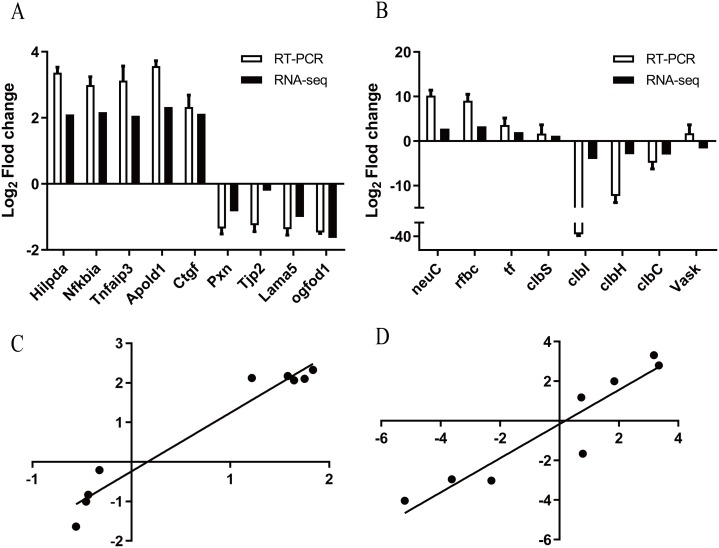
Figure 1. Validation of dual RNA-seq analysis.
(A) qRT-PCR analysis of bEnd.3 transcriptome representative genes identified by RNA-seq. The x-axis represents individual genes and the y-axis fold change in expression determined by RNA-seq (black bars) or qRT-PCR (white bars). All data are shown as means ± SD. BEnd.3 transcriptome representative genes are Hilpda (hypoxia inducible lipid droplet associated), Nfkbia (nuclear factor of kappa light polypeptide gene enhancer in B cells inhibitor, alpha), Tnfaip3 (tumor necrosis factor, alpha-induced protein 3), Apold1 (apolipoprotein L domain containing 1), Ctgf (connective tissue growth factor), Pxn (paxillin), Tjp2 (tight junction protein 2), Lama5 (laminin, alpha 5) and Ogfod1 (2-oxoglutarate and iron-dependent oxygenase domain containing 1). (B) qRT-PCR analysis of BEnd.3 transcriptome representative genes identified by RNA-seq. APEC strain transcriptome representative genes are clbS (colibactin self-protection protein clbS), neuC (UDP-N-acetylglucosamine 2-epimerase (hydrolyzing)), tf (type 1 fimbrial protein), rfbC (dTDP-4-dehydrorhamnose 3,5-epimerase), clbI (colibactin polyketide synthase ClbI), clbH (colibactin non-ribosomal peptide synthetase clbH), VasK (type VI secretion protein VasK) and clbC (colibactin polyketide synthase ClbC). All data are shown as means ± SD. (C) The correlation coefficient (R2) between the two data sets of bEnd.3 cells. The x-axis represents the log2 fold change in expression determined by qRT-PCR and the y-axis represents the log2 fold change in expression determined by RNA-seq. (D) The correlation coefficient (R2) between the two data sets of APEC strain. The x-axis represents the log2 fold change in expression determined by qRT-PCR and the y-axis represents the log2 fold change in expression determined by RNA-seq.

