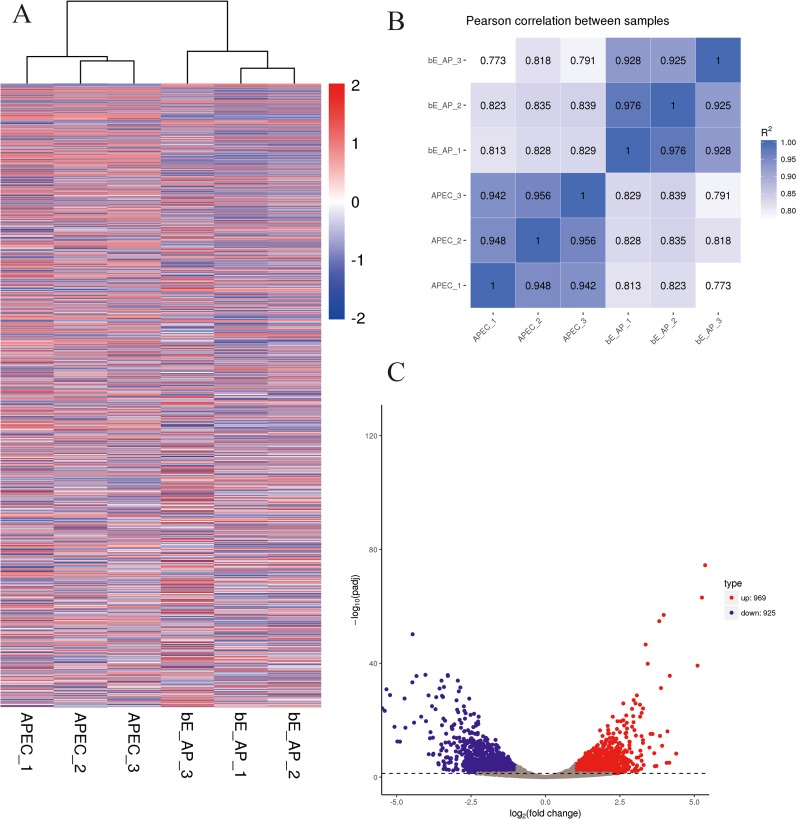
Figure 4. Differential expression overview profiles of APEC strain transcriptome data.
(A) Heat maps of APEC strain gene expression during infection or control samples. The read counts of each cellular mRNA were normalized by the sum of the total reads. Colors from white to red indicate upregulated cellular genes; colors from white to blue indicate downregulated cellular genes. (B) Pearson correlation between infection and control samples. (C) Volcano plot of P-values as a function of weighted fold change for mRNAs in infection and control groups. The vertical dotted line delimits up- and down-regulation. Red plots represent significant upregulated and green plots represent significant downregulated (|log2 fold change| ≥1, corrected P < 0.05).

