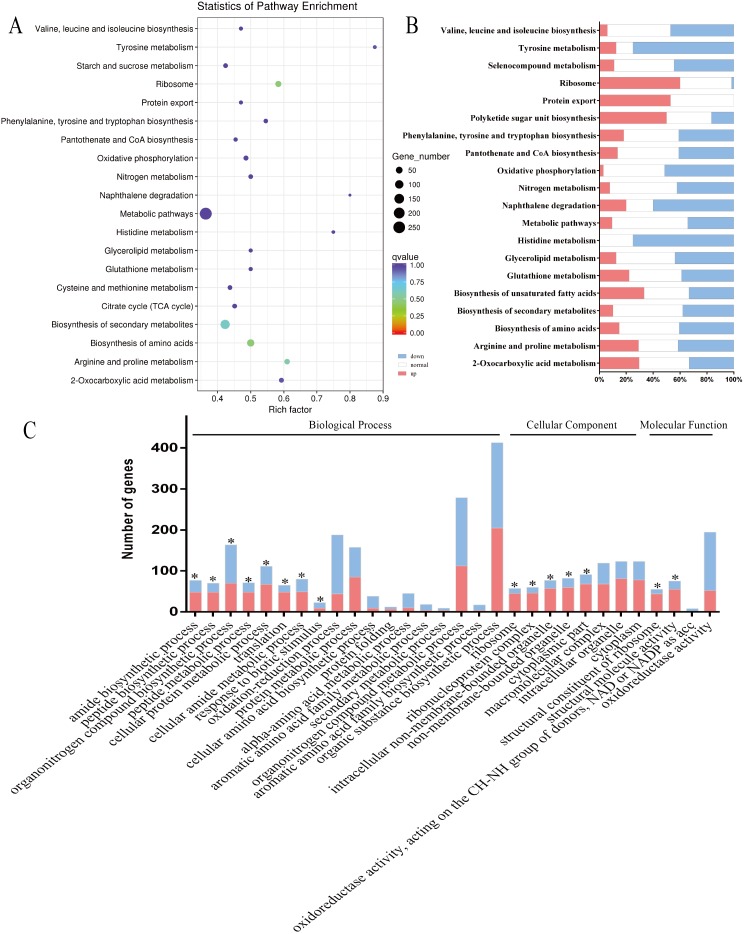
Figure 5. Enrichment analysis of KEGG pathways and GO terms for DEGs in APEC strain.
(A and B) The top 20 enriched KEGG pathways were classified as amino acid metabolism (7/20, Valine, leucine and isoleucine biosynthesis and Selenocompound metabolism, etc.), lipid metabolism (2/20, Biosynthesis of unsaturated fatty acids and Glycerolipid metabolism), energy metabolism (2/20, Nitrogen metabolism and Oxidative phosphorylation) and othe pathways. The size of each circle represents the number of DEGs in each pahway (larger circles represent more DEGs) and the color represents the corrected P value of each pathway. Red bars represent significant upregulated, blue bars represent significant downregulated and white bars represent no expression or no significant expression. (C) In the top 30 enriched GO terms, most terms (18/30) were classified as biological process, eight of them belonged to cellular component and four of them were classified as molecular function. Red bars represent significant upregulated and blue bars represent significant downregulated (|log2 fold change| ≥1, *corrected P < 0.05).

