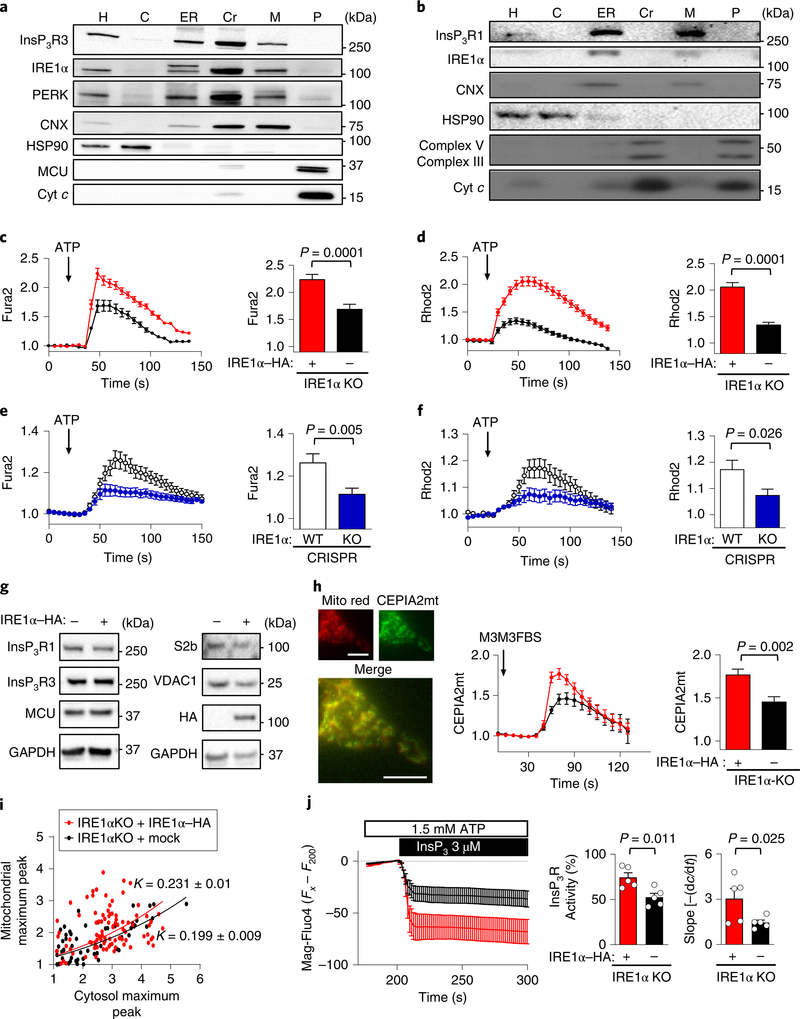
Fig. 1 |. IRE1α is located at MAMs and enhances mitochondrial calcium uptake.
a, IRE1α KO cells reconstituted with IRE1α–HA were processed to obtain purified MAM fractions followed by western blot analysis of indicated proteins (n = 3 independent experiments). H, homogenate; C, cytosol; Cr, crude mitochondria; M, MAMs; P, pure mitochondria; Cyt c, cytochrome c; CNX, calnexin. b, Liver extracts were processed to obtain subcellular fractions enriched for MAMs and analysed by western blot (n = 9 independent experiments). c,d, IRE1α KO cells reconstituted with IRE1α–HA or mock control were simultaneously imaged for calcium signals in the cytosol (Fura2; c) and mitochondria with Rhod2 (d). Left, the Fura2 ratio (c) and mean Rhod2 intensity (d) of normalized data before and after ATP is added; arrow, 100 μM ATP. Right, the data for the maximum peak are shown (total cells analysed: mock, n = 116 cells; IRE1α–HA, n = 138 cells). e,f, Similar experiments for Fura2 (e) and Rhod2 (f) were performed in CRISPR control and IRE1α KO cells (total cells analysed: control, n = 129 cells; IRE1α KO, n = 117 cells). WT, wild type. g, Indicated cell lines were processed for western blot analyses to monitor the levels of indicated proteins (n = 4 independent experiments). h, IRE1α null and control cells were imaged for calcium levels in mitochondria by transiently expressing CEPIA2mt mitochondrial calcium probe (left) after addition of 50 μM M3M3FBS (arrow), (Mito red; Mitochondrila Ds-Cherry control). Scale bars, 10 μm. Right, maximum CEPIA2mt intensity for every cell analysed (mock, n = 14 cells; IRE1α–HA, n = 14 cells). i, Maximum peaks from Fura2/Rhod2 measurements from samples described in c and d were calculated using nonlinear regression analyses to determine the correlation constant (K) and s.e.m. (mock, K = 0.199 ± 0.009; IRE1α–HA, K = 0.231 ± 0.01). j, Cells were imaged for calcium levels in the ER after loading with Mag-Fluo4 in permeabilized cells followed by stimulation with InsP3R (n = 5 independent experiments; left). Middle, percentage activity for InsP3R for each condition normalized to maximum release (ionomycin). Right, the first derivative was calculated. Data in c–f,h–j are mean ± s.e.m. Statistical differences were detected using two-tailed unpaired Student’s t-tests except for j; right, which was one-tailed. Source data for statistical analyses are provided in Supplementary Table 6.

