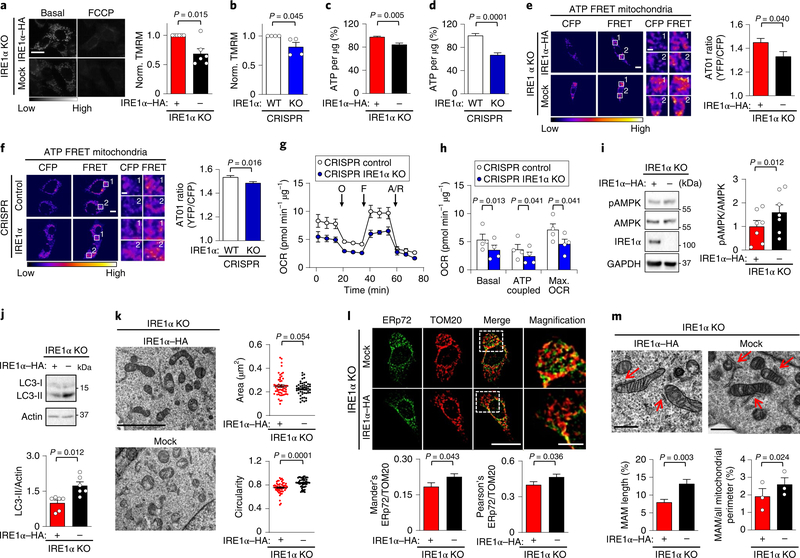
Fig. 2 |. IRE1α expression bursts basal mitochondrial bioenergetics.
a, IRE1α KO cells that were reconstituted with either IRE1α–HA or an empty vector (mock) were imaged for TMRM signals before and after addition of 1 μM FCCP (carbonyl cyanide-p-trifluoromethoxyphenylhydrazone) (left). Scale bar, 20 μm. Right, mean TMRM intensity normalized to IRE1α–HA cells (n = 6 independent experiments). b, CRISPR control and IRE1α KO cells were analysed as described in a (n = 4 independent experiments). c,d, Percentage of ATP of the indicated cells using a luminescence assay (n = 18 biologically independent samples). e,f, ATP levels were measured in the indicated cell lines using the AT01 mitochondrial (yellow fluorescent protein (YFP)/cyan fluorescent protein (CFP)) FRET probe FRET labeling stands for 440 nm excitation emmited in YFP channel. White numbers indicate regions of interest (left). Right, quantification of YFP/CFP ratio excited at 440 nm (mock, n = 52 cells; IRE1α–HA, n = 58 cells; control, n = 145 cells; IRE1α KO, n = 151 cells). Scale bars, 10 μm and 2 μm. g,h, The indicated cell lines were analysed for oxygen consumption rate (OCR). O, 1 μM oligomycin, F, 0.5 μM FCCP; A/R = 1 μM antimycin/rotenone (n = 4 independent experiments). i, pAMPK was analysed in the indicated cells using western blots (left) and normalized to total AMPK levels (right; n = 6 independent experiments). j, Determination of LC3-II levels in the indicated cell lines using western blots (left), followed by quantification normalizing to actin (right; n = 6 independent experiments). k, TEM-derived morphological parameters of mitochondria were obtained from indicated cells. Scale bar, 4 μm (left). Right, the data represent the area in μm2 and circularity (mock, n = 52 cells; IRE1α–HA, n = 58 cells). l, Cells were stained for ERp72 and TOM20 by indirect immunofluorescence (left) followed by colocalization quantification (right; Mander’s index: mock, n = 33 cells; IRE1α–HA, n = 40 cells; Pearson’s index: mock, n = 68 cells; IRE1α–HA, n = 78 cells). Scale bar, 20 μm and 5 μm. m, The indicated cells were imaged using TEM to visualize MAMs (pointed with red arrows) (left) using two quantification methods (right; mock, n = 38 contacts; IRE1α–HA, n = 30 contacts). Scale bars, 500 nm. Data in a–m are mean ± s.e.m. Statistical differences detected with one-tailed (k) or two-tailed unpaired Student’s t-tests. A Wilcoxon signed-rank test was applied in a–d and paired Student’s t-tests were applied in h,i,m (right panel). Source data for statistical analyses are provided in Supplementary table 6.

