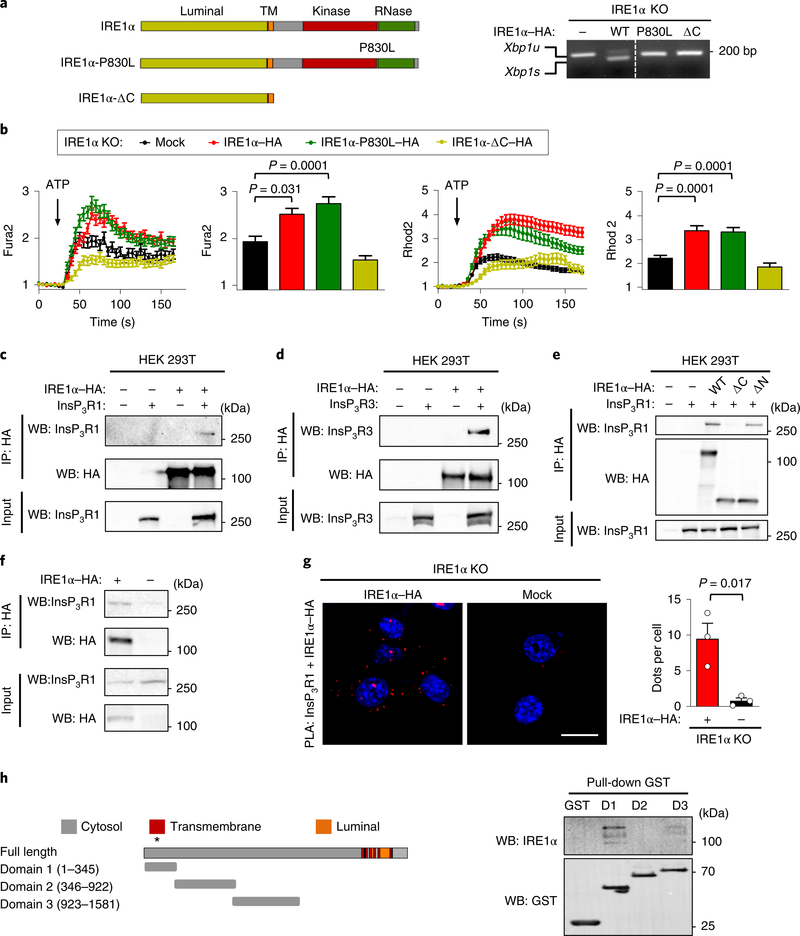
Fig. 4 |. IRE1α physically interacts with InsP3Rs and controls mitochondrial calcium uptake independent of its enzymatic activities.
a, Schematic of IRE1α structure and the mutants analysed (left) (TM; transmembrane domain). Right, the indicated cell lines were treated with 0.1 μg ml−1 tunicamycin for 4 h and then Xbp1 mRNA splicing was evaluated using PCR analysis. The agarose gel image was sliced to eliminate irrelevant lanes. Xbp1u, unspliced Xbp1s, spliced (n = 2 independent experiments). b, Calcium levels in the cytosol after ATP stimulation were analysed in IRE1α KO cells reconstituted with the indicated constructs. Arrow, 100 μM ATP (left; Fura2; n = 4 independent experiments; total cells analysed: mock, n = 131 cells; IRE1α–HA, n = 149 cells; IRE1α-P830L–HA, n = 120 cells; IRE1α-ΔC–HA, n = 97 cells). The maximum peak for the normalized Fura2 ratio was measured (middle). The same cells were imaged simultaneously with Rhod2 to measure mitochondrial calcium uptake. Arrow, 100 μM ATP (right two panels). c–e, HEK293T cells were transiently transfected with the indicated constructs and immunoprecipitation (IP) was performed using anti-HA antibodies. Western blot (WB) analysis was performed for the indicated proteins in immunoprecipitations and total input (c, n = 3 independent experiments; d,e are representative of two independent experiments). f, The indicated MEF cell lines were processed for immunoprecipitation using anti-HA antibodies. Western blot analysis was performed for the indicated proteins in immunoprecipitations and total input. g, Cells described in f were stained for PLA (red) and DAPI (blue) using anti-InsP3R1 antibodies paired with anti-HA antibodies and analysed by confocal microscopy. Scale bar, 20 μm (left). Right, the number of dots per cell were quantified (n = 3 independent experiments). h, Schematic of InsP3R1 domains used to generate recombinant proteins and perform in vitro pull-down assays (left; the asterisk indicates that residues 167–169 and 267 are relevant for channel function). Right, in vitro pull-down assay for purified GST-fused domains of InsP3R1 with recombinant IRE1α cytosolic portion (IRE1α-ΔN) followed by western blot analysis (D1, domain 1; D2, domain 2; D3, domain 3; n = 3 independent experiments). Data in b and g are mean ± s.e.m. Statistical differences were detected using two-tailed unpaired Student’s t-test (g) or ANOVA with Tukey multiple comparison test (b). Source data for statistical analyses are provided in Supplementary Table 6.

