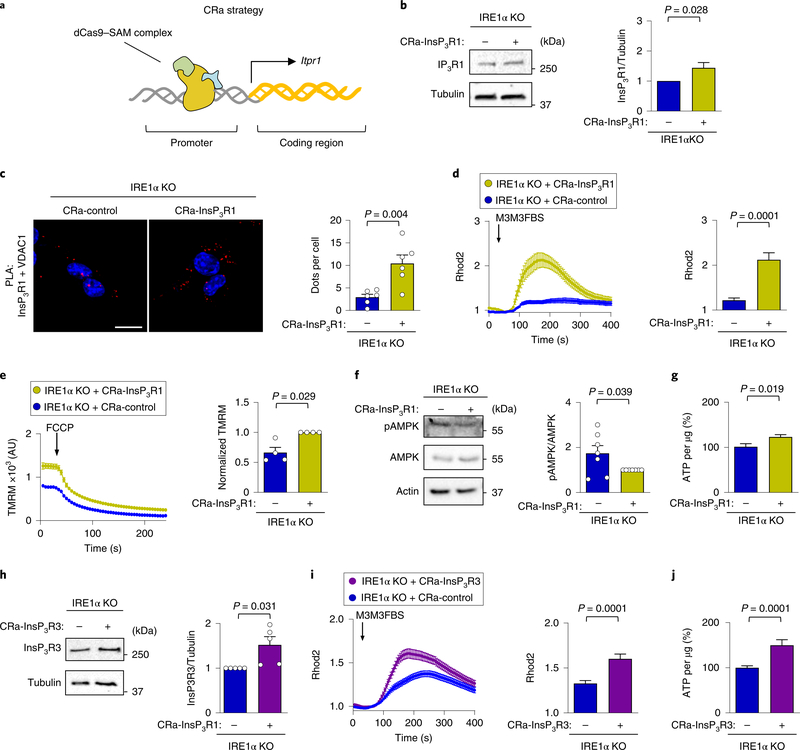
Fig. 5 |. Upregulation of endogenous InsP3Rs rescue mitochondrial calcium uptake in IRE1α-deficient cells.
a, Strategy to generate CRa particles using the synergistic activator mediators and sgRNA complex. b, IRE1α KO cells were generated that stably express either a CRa that targets the InsP3R1 promoter or a control vector. Representative western blot analysis of the indicated proteins was performed to confirm InsP3R1 upregulation (n = 10 independent experiments). c, The cells described in a were stained with a PLA (red) DAPI (blue) using anti- InsP3R1 and anti-VDAC1 antibodies, and were analysed by confocal microscopy. Scale bar, 20 μm (left). Right, the number of dots per cell were quantified (n = 6 independent experiments). d, CRa-InsP3R1 or CRacontrol cells were imaged with Rhod2 to measure mitochondrial calcium uptake. Arrow, stimulation using 50 μM M3M3FBS (left). Right, the maximum peak for normalized Rhod2 was calculated (total cells analysed: CRa-InsP3R1, n = 46 cells; CRa-control, n = 42 cells). e, CRa-InsP3R1 or CRa-control cells were imaged for mitochondrial membrane potential after TMRM staining (left). Arrow, stimulation with 1 μM FCCP; AU, arbitrary units. Right, normalized TMRM intensity (n = 4 independent experiments). f, pAMPK and total AMPK levels were determined in CRa-InsP3R1 or CRa-control cells using western blot (left). Right, quantification of the pAMPK/AMPK ratio (n = 7 independent experiments). g, The indicated cells were lysed and ATP levels were determined using a luminescence assay (n = 13 biologically independent experiments). h, IRE1α KO cells were generated that stably express either a CRa that targets the InsP3R3 promoter or a control vector. Representative western blot analysis of the indicated proteins was performed to confirm InsP3R3 upregulation (n = 5 independent experiments). i, The indicated cells were imaged with Rhod2. Arrow, stimulation with 50 μM M3M3FBS (left). Right, the maximum peak for the normalized Rhod2 was calculated (total cells analysed: CRa-InsP3R1, n = 132 cells; CRa-control, n = 112 cells). j, ATP levels were determined in the indicated cells using a luminescence assay (n = 25 biologically independent experiments). Data in b–j are mean ± s.e.m. Statistical differences were detected with unpaired Student’s t-tests (c,d,g,i,j) or Wilcoxon signed-rank test (b,e,f,h). Source data for statistical analyses are provided in Supplementary Table 6.

